Fault Tree Analysis (FTA) is a systematic, deductive method for analyzing system failures and identifying their root causes. It has a rich history. Bell Labs initially developed FTA in the 1960s for the U.S. Air Force, marking a significant milestone in risk assessment.
Today, FTA has evolved into a cornerstone methodology for aerospace, nuclear energy, manufacturing, and healthcare industries.
FTA plays a crucial role in enhancing organizations' safety, reliability, and operational efficiency by modeling how different component failures can lead to a more significant system failure.
This article thoroughly explores Fault Tree Analysis (FTA), covering its methodology, components, applications, benefits, limitations, and implementation steps.
What is Fault Tree Analysis?
Fault Tree Analysis is a top-down, logic-gate-based methodology used to identify and assess potential causes of system failures. It employs a graphical representation called a fault tree, which maps the relationships between a top-level system failure (known as the Top Event) and its underlying causes.
The fault tree uses logic gates—AND, OR, etc.—to model the combinations of events (failures or errors) that could lead to the Top Event. This visualization aids in both qualitative and quantitative risk analysis.
“Fault Tree Analysis is a top-down, logic-gate-based methodology used to identify and assess potential causes of system failures.”
Key Components of Fault Tree Analysis
It is essential to familiarize yourself with its core components to understand and implement Fault Tree Analysis effectively:
1. Top Event
The system failure or undesirable event being analyzed. Examples include "aircraft engine failure" or "system data breach."2. Intermediate Events
Failures occur between the Top Event and the basic causes. They typically result from combinations of lower-level failures.3. Basic Events
The root causes of failures are generally component failures, human errors, or external factors, and they are represented as circles in the fault tree.4. Logic Gates
Symbols used to illustrate relationships between events:- AND Gate: The output event occurs only if all input events occur.
- OR Gate: Represents a scenario where any input event can cause the output event to occur.
5. Transfer Symbols
Used to connect fault trees when analyzing complex systems with multiple subsystems.6. Probability Data
Quantitative analysis requires the assignment of failure probabilities to basic events to calculate the likelihood of the Top Event.Steps in Fault Tree Analysis
Fault Tree Analysis follows a structured process divided into the following steps:
1. Define the Top Event
Clearly define the undesirable event to be analyzed. Ensure the scope is well-delineated to avoid unnecessary complexity.2. Construct the Fault Tree
Start with the Top Event and work downward, identifying intermediate and basic events using logic gates to model their relationships.3. Identify Root Causes
Break down intermediate events into basic events until you identify all potential root causes.4. Assign Probabilities
Assign failure probabilities to each basic event for quantitative FTA using historical data, testing, or expert judgment.5. Analyze the Fault Tree
Use qualitative analysis to identify critical paths leading to failure and quantitative analysis to calculate the likelihood of the Top Event.6. Evaluate and Mitigate Risks
Based on the analysis, implement strategies to reduce the probability of the Top Event by addressing high-risk basic events.Applications of Fault Tree Analysis
FTA is a versatile tool used in various industries for diverse applications:
1. Aerospace:
- Analyzing flight system reliability.
- Investigating causes of aircraft accidents.
- Ensuring reactor safety.
- Assessing risks of radiation release.
- Enhancing product quality.
- Preventing equipment downtime.
- Improving patient safety by analyzing medical equipment failures.
- Investigating adverse events in clinical processes.
- Assessing risks of system outages or cybersecurity breaches.
- Evaluating the reliability of rail, road, and maritime systems.
- Investigating vehicle crashes or system malfunctions.
Benefits of Fault Tree Analysis
FTA offers significant benefits that make it an indispensable tool for risk assessment and system reliability analysis:
- Systematic and Visual: FTA provides a clear, logical framework for analyzing system failures, making it easier to identify weak points.
- Quantitative Insights: By assigning probabilities to events, FTA enables precise calculation of failure likelihoods, aiding in resource allocation and risk mitigation.
- Prioritization: Identifies the most critical components or events that contribute to system failures, helping focus corrective actions.
- Proactive Approach: Facilitates the identification of potential failures before they occur, reducing downtime and costs associated with reactive measures.
- Regulatory Compliance: Demonstrates due diligence and robust risk assessment practices, often required in safety-critical industries.
Limitations of Fault Tree Analysis
Despite its strengths, FTA has certain limitations:
- Data Dependence: Reliable probability data for basic events may be unavailable or difficult to estimate, limiting the accuracy of quantitative analysis.
- Time-Consuming: Constructing and analyzing complex fault trees can be resource-intensive, especially for large systems.
- Static Model: FTA does not account for dynamic factors such as time-dependent changes or interactions between components.
- Subjectivity: The quality of FTA results depends on the expertise of the analysts, potentially introducing bias or oversight.
- Single-Point Focus: FTA focuses on one Top Event at a time and may not capture interdependencies between multiple potential failures.
Techniques for Effective Fault Tree Analysis
To maximize the value of FTA, consider the following best practices:
- Collaborative Approach: Involve cross-functional teams to ensure comprehensive identification of potential failures and accurate assignment of probabilities.
- Use Software Tools: Employ specialized FTA software to streamline the construction, analysis, and documentation of fault trees.
- Integrate with Other Methods: Combine FTA with Failure Modes and Effects Analysis (FMEA), 5 Whys, event tree analysis, or reliability block diagrams for a holistic view of system risks.
- Validate Results: Cross-check fault trees with real-world data or simulations to confirm their accuracy.
- Iterative Process: Update fault trees regularly to reflect changes in system design, operational conditions, or failure data.
Example of fault tree analysis: Fault Tree Analysis in Aerospace
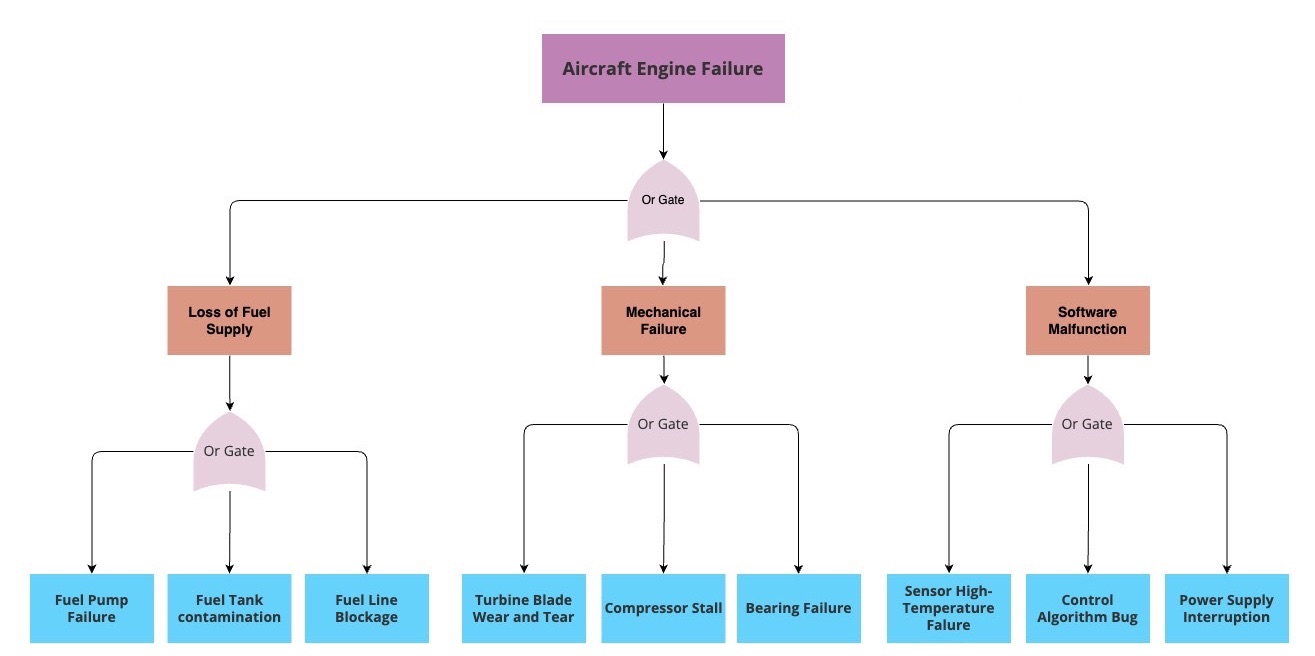
A practical example of fault tree analysis is its application in the aerospace industry to analyze engine failure in an aircraft:
1. Top Event:
- Aircraft engine failure during flight.
- Loss of fuel supply.
- Mechanical failure of critical components.
- Software malfunction in the control system.
- FPF: Fuel Pump Failure
- FTC: Fuel Tank Contamination
- FLB: Fuel Line Blockage
- TBWT: Turbine Blade Wear and Tear
- CS: Compressor Stall
- BF: Bearing Failure
- SHT: Sensor High-Temperature Failure
- CAB: Control Algorithm Bug
- PSI: Power Supply Interruption
- Quantitative analysis reveals that fuel pump failure and turbine blade wear are the most probable causes of the Top Event.
- Regular inspection and maintenance of fuel pumps.
- Use of higher-grade materials for turbine blades.
Enhance Reliability Through Fault Tree Analysis
Fault Tree Analysis is a robust methodology for understanding and mitigating system failures. By combining logical reasoning with quantitative analysis, FTA helps organizations identify vulnerabilities, prioritize risk mitigation strategies, and enhance system reliability. While it has limitations, its benefits far outweigh them, primarily when used in conjunction with other risk assessment tools.
In an increasingly complex and safety-conscious world, mastering FTA is essential for engineering, safety, and quality management professionals. With careful implementation and regular updates, FTA can significantly contribute to safer, more efficient operations across industries.