
Asset management seeks to optimize the performance and lifespan of physical assets while minimizing costs and mitigating risk. A vital component of this strategy is predictive maintenance, which aims to identify potential issues before they fail.
In predictive maintenance, the P-F Curve and the P-F Interval are critical tools for understanding asset health, determining maintenance timing, and managing risk. This article explores the P-F Curve and P-F Interval, examining how they help asset managers make informed, proactive decisions to enhance asset reliability and reduce downtime.
What is the P-F Curve?
The P-F Curve is a graphical representation that illustrates an asset’s deterioration process over time. It shows the progression from a point where a potential failure in the asset can first be detected (Point P) to the point of functional failure (Point F). Asset management aims to detect and address the potential defect at or shortly after Point P, well before it progresses to Point F.
The stages on the P-F Curve can generally be described as follows:
- Point P - Potential Failure: The initial point where a potential defect or anomaly is first detectable. The asset is still functional, but signs of degradation are present.
- Progressive Deterioration: As time progresses, the defect worsens. The asset continues functioning, but the defect gradually impairs its efficiency, safety, or performance.
- Point F - Functional Failure: The point at which the asset can no longer perform its intended function. Functional failure often results in unplanned downtime, safety risks, or costly repairs.
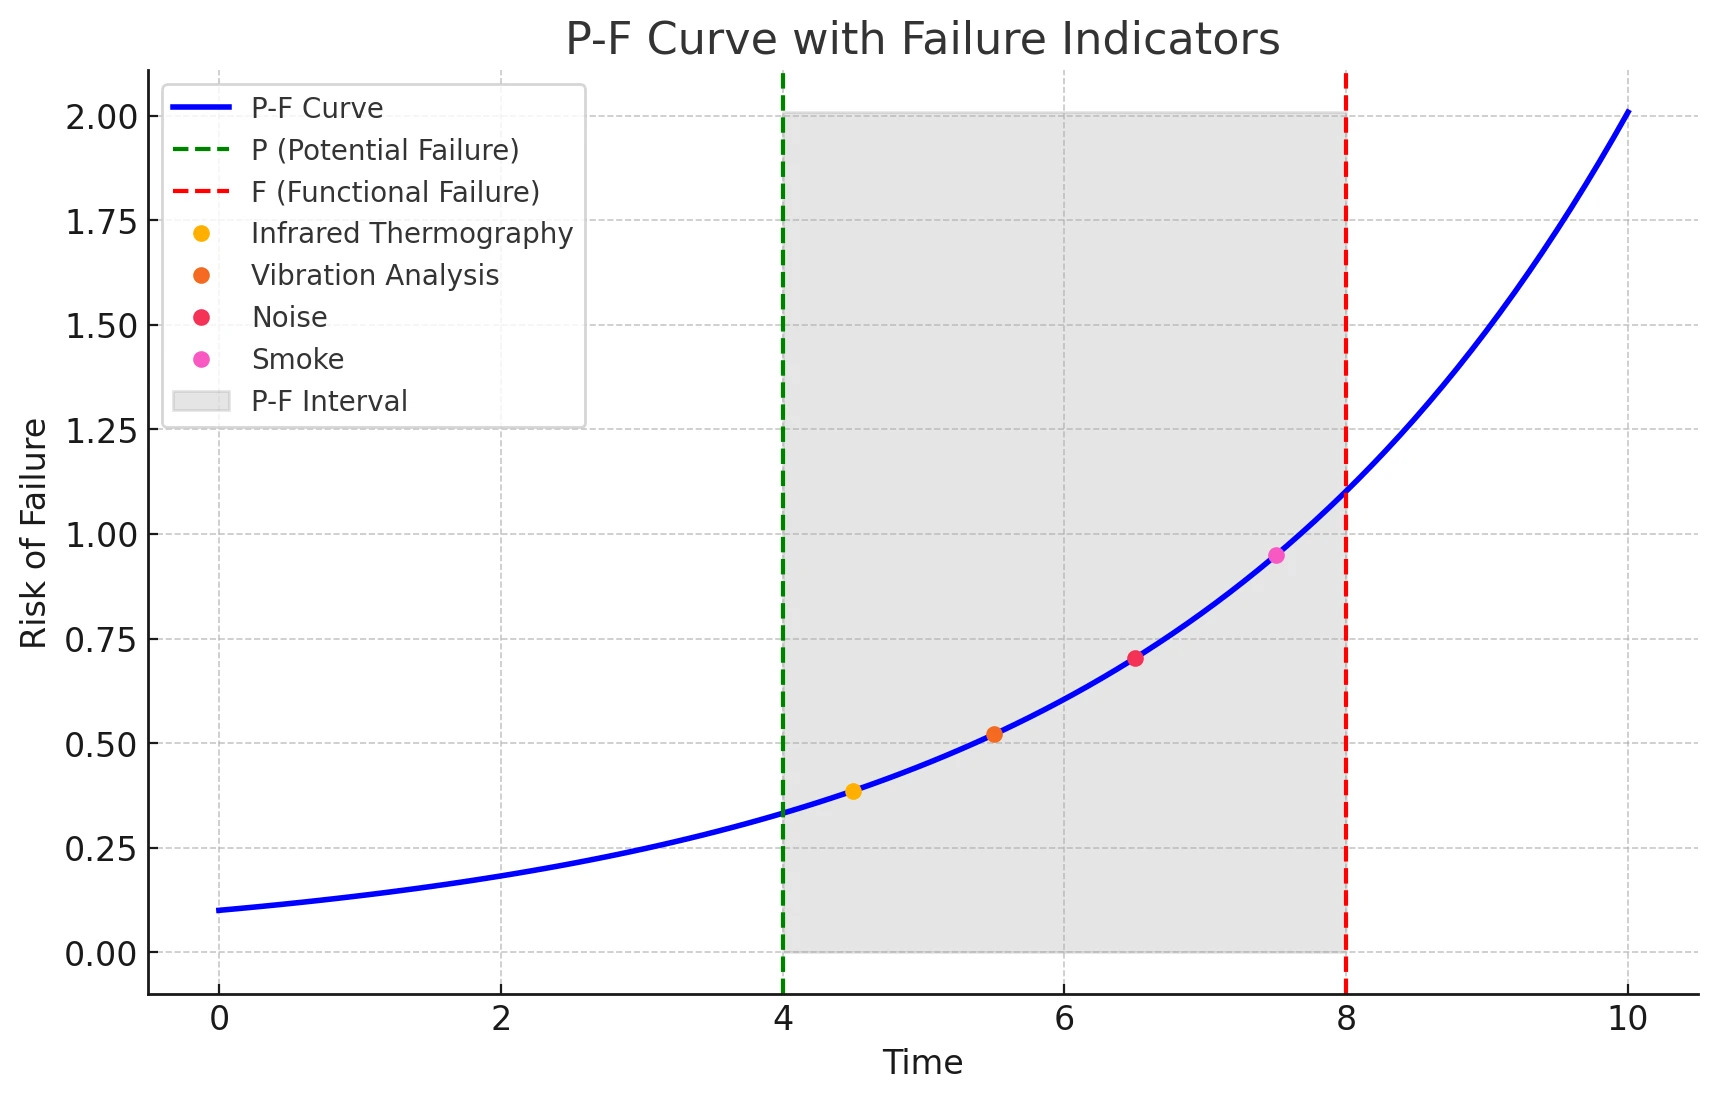
The P-F Curve is valuable in illustrating that asset failure is rarely instantaneous. Instead, it is often the result of gradual deterioration, which, if monitored correctly, can be detected and mitigated. The curve emphasizes the importance of early intervention, showing that asset managers can make proactive repairs or adjustments to avoid costly, unplanned failures.
Understanding the P-F Interval
The P-F Interval represents the time between the points P (Potential Failure) and F (Functional Failure) on the P-F Curve. This interval is crucial because it defines the window within which maintenance or repairs should ideally be carried out to prevent a failure. The P-F Interval varies depending on the type of asset, operating conditions, and the nature of the defect.
The P-F Interval can be broken down as follows:
- P (Potential Failure): The point when a defect is first detectable.
- Interval Between P and F: This is the “opportunity window” for intervention. The length of this interval varies but provides a critical timeframe during which maintenance actions can prevent failure.
- F (Functional Failure): The asset can no longer fulfill its intended role.
The Role of the P-F Curve and P-F Interval in Asset Management
For effective asset management, understanding the P-F Curve and Interval is essential. The goal is to optimize maintenance schedules and minimize downtime by intervening at the right time in the asset lifecycle. Here’s how these tools contribute to asset management:
1. Informed Maintenance Planning
Asset managers can create maintenance schedules that align with actual asset conditions by identifying potential failure points and understanding the time window before functional failure. This approach, known as condition-based or predictive maintenance, is more efficient than time-based maintenance, which may result in unnecessary costs or overlooked issues.2. Risk Management and Reliability
Predictive maintenance enabled by the P-F Curve helps reduce the risk of unexpected failures, enhancing asset reliability. Knowing the P-F Interval allows managers to prioritize assets with shorter intervals, ensuring high-risk assets are closely monitored and attended to promptly.3. Cost Control and Resource Allocation
Unplanned failures often result in expensive repairs, production delays, and safety risks. Maintenance managers can avoid these costs by intervening before Point F. Moreover, the P-F Curve helps optimize resource allocation, as maintenance teams can focus on assets closer to Point F or show signs of rapid deterioration.4. Enhanced Safety
Preventing functional failure is critical in industries where asset failure can have severe safety implications. The P-F Interval provides a lead time for addressing potentially hazardous issues before they escalate.Monitoring and Tools for Managing the P-F Curve and P-F Interval
Today, maintenance teams benefit from advanced monitoring tools that help detect early-stage failures along the P-F Curve. Techniques such as:
- Vibration analysis
- Ultrasonic testing
- Thermography
- Oil analysis
- Acoustic monitoring
Additionally, predictive analytics and machine learning models can enhance the accuracy of failure predictions, enabling proactive asset management.
Implementing these monitoring techniques can extend the P-F Interval by identifying issues earlier in the defect cycle. Extending the P-F Interval is particularly valuable for critical assets, as it ensures sufficient lead time to address defects before they impact operations.
Improve Asset Management
The P-F Curve and P-F Interval are powerful concepts that provide a framework for effective asset management.
Asset managers can optimize performance, reduce costs, and minimize unplanned downtime by understanding the deterioration process of assets and the window available for maintenance intervention.
Leveraging monitoring technologies to extend the P-F Interval further enhances these benefits, leading to a proactive, reliable, and efficient asset management strategy.