
Weibull analysis is a statistical technique commonly used in reliability engineering and life data analysis to assess the probability of failure and predict the lifespan of products and systems. Named after Swedish engineer and scientist Waloddi Weibull, who introduced the distribution in 1951, the Weibull distribution is a versatile tool for modeling various types of failure data.
It provides insights into product reliability, failure rates, and the probability of survival over time, helping organizations make informed decisions about maintenance, product design, and risk management.
The versatility of the Weibull distribution lies in its ability to model different types of failure behavior—such as early-life failures (infant mortality), constant failure rates, and wear-out failures—depending on the shape of the data.
This adaptability makes it a valuable tool in industries ranging from manufacturing and aerospace to electronics and healthcare.
This article provides a comprehensive overview of Weibull analysis, including its fundamental principles, workings, key parameters, the process of performing Weibull analysis, and practical applications across various industries.
What is Weibull Analysis?
Weibull analysis is a method of statistically analyzing life data, typically failure times, to understand a product or system's reliability and failure characteristics. The technique revolves around the Weibull distribution, a probability distribution used to describe a system or component's time to failure.
The Weibull distribution is highly flexible because, depending on its shape parameter, it can take on the characteristics of other standard distributions, such as the exponential and normal distributions.
This flexibility allows it to model various failure behaviors, making it a popular tool for engineers looking to predict product reliability and life expectancy.
The core goal of Weibull analysis is to model the probability of failure of a system or component over time, helping engineers and managers make data-driven decisions about maintenance schedules, design improvements, and reliability testing.
The Weibull Distribution Formula
The probability density function (PDF) of the Weibull distribution is given by:
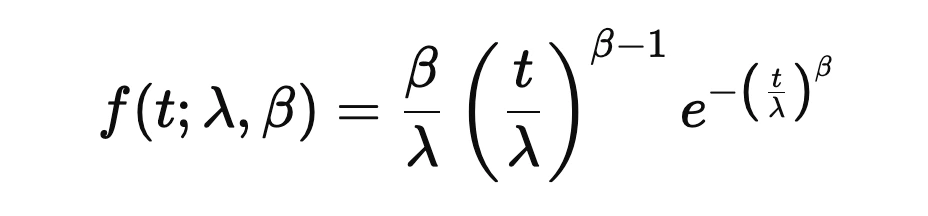
Where:
- t represents the time to failure.
- λ (scale parameter) determines the characteristic life of the product or system, which is when 63.2% of the population has failed.
- β (shape parameter) controls the shape of the distribution, indicating the failure rate behavior over time.
The Cumulative Distribution Function (CDF)
The cumulative distribution function, which represents the probability that the failure time is less than or equal to a given time t, is given by:
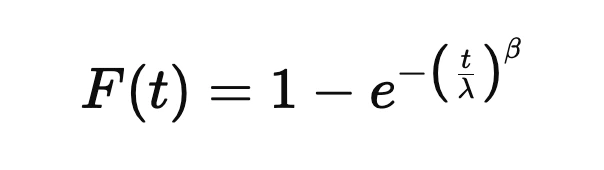
This function helps understand the proportion of failures over time and is essential in predicting product life expectancy.
Key Parameters in Weibull Analysis
1. Shape Parameter (β): The shape parameter, also known as the Weibull slope, defines the nature of the failure rate.
- β < 1: The system experiences early failures (infant mortality). The failure rate decreases over time.
- β = 1: The system has a constant failure rate, characteristic of random failures. In this case, the Weibull distribution reduces to an exponential distribution.
- β > 1: The system exhibits wear-out failures, and the failure rate increases over time.
3. Location Parameter (γ): A location parameter is sometimes introduced to shift the distribution along the time axis. This parameter indicates the earliest possible time for failure to occur.
The Importance of Weibull Analysis
Weibull analysis is a critical tool in reliability engineering and risk management for several reasons:
1. Failure Prediction and Maintenance Planning
Weibull analysis helps engineers predict when equipment or components are likely to fail. Organizations can schedule preventive maintenance more effectively by modeling failure behavior, reducing the risk of unexpected failures, and optimizing resource use.Knowing when failures are most likely to occur allows companies to avoid costly downtime and increase overall operational efficiency.
2. Product Design Improvement
The insights gained from Weibull analysis can inform product design decisions. For example, engineers can investigate the root causes of early-life failures and redesign components to improve reliability. Conversely, wear-out failures may indicate that engineers should upgrade materials or components to extend product life.3. Cost Reduction
Organizations can reduce the costs associated with warranty claims, repairs, and unplanned downtime by identifying and addressing failure patterns. Weibull analysis helps balance the trade-offs between product performance and maintenance, replacement, and quality control costs.4. Reliability Testing
Weibull analysis is frequently used in reliability testing to estimate product lifetimes and set reliability goals. Companies use the technique to test products under various conditions, allowing them to identify weak points and validate the reliability of new designs before market release.5. Risk Management
In safety-critical industries such as aerospace, healthcare, and nuclear energy, reliability engineers use Weibull analysis to assess the risk of failure in equipment or systems. Understanding the likely risk of failure helps implement appropriate safety measures and regulatory compliance strategies, ensuring safe and reliable operations.Performing a Weibull Analysis: Step-by-Step Guide
Conducting a Weibull analysis involves collecting failure data, fitting the Weibull distribution to the data, and interpreting the results. Below is a step-by-step process to conduct a Weibull analysis:
Step 1: Collect Failure Data
The first step in performing a Weibull analysis is collecting data related to the failures of the system or components to be analyzed. This data can be in the form of:- Complete failure data: The exact times at which failures occurred.
- Censored data: When failures have yet to occur, but the system is known to have survived until a specific time (right-censored data). Censoring is common in reliability testing when products are still functioning at the end of the test period.
Step 2: Fit the Weibull Distribution to the Data
Once the failure data is collected, the next step is to fit a Weibull distribution to the data using statistical software, reliability analysis tools, or even manual methods such as plotting the data on Weibull probability paper.When fitting the distribution, the primary objective is to estimate the parameters β\betaβ (shape) and λ\lambdaλ (scale). Reliability engineers can achieve this using methods such as:
- Maximum Likelihood Estimation (MLE): A statistical method that estimates the parameters by maximizing the likelihood that the observed data fits the distribution.
- Least Squares Method: A mathematical technique that minimizes the sum of the squared differences between the observed data and the predicted values from the Weibull distribution.
Step 3: Plot the Weibull Probability Plot
A Weibull probability plot is a graphical tool for assessing whether the data follows a Weibull distribution. If the data points form a straight line on the plot, the Weibull distribution is a good fit for the data.On this plot:
- The horizontal axis represents the time to failure.
- The vertical axis represents the cumulative failure probability (calculated using the CDF).
- The slope of the line corresponds to the shape parameter (β).
Step 4: Interpret the Results
Once Reliability engineers fit the Weibull distribution to the data, they use parameters β\betaβ and λ\lambdaλ to interpret the failure behavior and reliability characteristics of the system:- β < 1: Indicates early failures or infant mortality. Preventive measures should focus on identifying and correcting defects during early usage.
- β = 1: Indicates random failures, suggesting that failure events are independent of time. Random failure is often associated with constant hazard rate processes like electronic components.
- β > 1: Indicates wear-out failures, where failure rates increase over time. Organizations should target maintenance efforts toward preventing aging and degradation.
Step 5: Use the Results for Decision Making
The final step is to use the results of the Weibull analysis to make informed decisions about maintenance, product design, or risk management. For instance:- If the analysis shows early-life failures (β<1), the organization can allocate resources to improve quality control during production.
- If the analysis shows wear-out failures (β>1), Reliability engineers can adjust preventive maintenance schedules to replace parts before they fail.
Applications of Weibull Analysis in Various Industries
Weibull analysis has broad applications across different industries:
Manufacturing
In manufacturing, reliability engineers use Weibull analysis to predict the reliability of machinery, equipment, and products. It helps manufacturers design better products, reduce warranty claims, and optimize maintenance schedules to minimize downtime.Aerospace and Defense
The aerospace industry uses Weibull analysis to assess the reliability of critical components, such as engines and avionics systems. The analysis helps ensure that aircraft meet stringent safety requirements and regulatory standards.Healthcare and Medical Devices
Weibull analysis is applied to predict medical devices' reliability and failure rates in the healthcare sector. The analysis helps manufacturers improve device safety and ensures compliance with regulatory requirements.Automotive Industry
Automobile manufacturers use Weibull analysis to assess the lifespan of components such as engines, brakes, and transmission systems. This allows for the development of more reliable vehicles and cost-effective maintenance schedules.Energy and Utilities
In the energy sector, reliability engineers use Weibull analysis to predict the failure rates of equipment like wind turbines, generators, and transformers. Having this data helps utility companies minimize downtime, improve asset management, and reduce maintenance costs.Challenges in Weibull Analysis
While Weibull analysis is a powerful tool, there are challenges in its application:
- Data Quality: Inaccurate or incomplete failure data from CMMS software can lead to incorrect conclusions. High-quality data is essential for reliable analysis.
- Censored Data: Dealing with censored data can complicate the analysis, especially when only partial failure information is available.
- Complex Failure Modes: Not all failure data may fit a Weibull distribution. In some cases, reliability engineers may require more complex models or a mixture of distributions.
Conclusion
Weibull analysis is an essential tool in reliability engineering that provides critical insights into product and system failures. By modeling failure data using the Weibull distribution, organizations can predict failure rates, optimize maintenance schedules, improve product design, and make data-driven decisions that reduce costs and improve operational efficiency.
Its flexibility in modeling various failure behaviors, from early-life failures to wear-out phases, makes it a widely used method across industries.
Despite its challenges, when applied correctly with accurate data and proper analysis techniques, Weibull analysis offers a powerful way to enhance the reliability and performance of assets, systems, and products.
Whether in manufacturing, aerospace, healthcare, or energy, Weibull analysis helps organizations achieve operational excellence and ensure the reliability of their products.