
A manufacturing plant I worked with last year had a planned maintenance percentage of 23%. Their maintenance team spent most days chasing breakdowns, ordering emergency parts at premium prices, and having meetings with production managers about missed deadlines. Six months later, they hit 71%. Equipment failures dropped by 40%, and their overtime budget shrank by half.
The difference wasn't magic. It wasn't even expensive. What changed was their approach to a metric that most maintenance teams either ignore or misunderstand.
Planned maintenance percentage tells you something fundamental about your operation: are you controlling your maintenance schedule, or is your equipment controlling you? A low number means you're constantly reacting. A high number means you're anticipating problems before they become emergencies.
Most facilities hover somewhere between 30% and 50% planned maintenance. World-class operations push above 85%. The gap between these numbers represents millions of dollars in lost productivity, unnecessary parts spending, and equipment that dies years before it should.
Here's what actually moves the needle.
Understanding What You're Actually Measuring
The calculation itself is simple: divide your planned maintenance hours by total maintenance hours, then multiply by 100. If your team logged 400 hours of planned work and 600 total hours last month, your planned maintenance percentage is 67%.

But the simplicity hides some important nuances that trip up maintenance managers.
Planned maintenance includes any work scheduled at least a week in advance with all necessary parts, tools, and documentation ready. This covers preventive maintenance tasks, scheduled inspections, planned repairs identified during inspections, and condition-based maintenance triggered by monitoring data. The key distinction is scheduling and preparation, not just the type of work.
Reactive maintenance is everything else: emergency breakdowns, urgent repairs, and work orders created and completed within 24 hours. Even if you technically "planned" a repair by creating a work order that morning, it doesn't count as planned maintenance.
Some teams inflate their numbers by counting same-day work as planned. This defeats the purpose. The metric exists to measure how much control you have over your maintenance schedule. If you're scheduling work the morning it happens, you don't have control.
A realistic target for most facilities is 80% planned maintenance. Getting there from 30% or 40% typically takes 12 to 18 months of focused effort. Expecting faster results usually leads to gaming the metric rather than genuine improvement.
Why Low Numbers Persist Even When Teams Work Hard
The frustrating reality is that maintenance teams with low planned maintenance percentages often work harder than teams with high percentages. They're constantly responding to emergencies, working overtime, and scrambling to keep equipment running.
The problem isn't effort. It's a self-reinforcing cycle that traps teams in reactive mode.
When equipment breaks unexpectedly, technicians drop planned work to address the emergency. The deferred planned work creates a backlog. As the backlog grows, more equipment misses its scheduled maintenance. Poorly maintained equipment fails more often. More failures mean more emergencies. The cycle accelerates.
Breaking this cycle requires understanding what feeds it. Three factors typically keep planned maintenance percentages low.
Incomplete asset information. If you don't know what equipment you have, its condition, and its maintenance requirements, you can't plan effectively. Many facilities have equipment that's never been added to their maintenance system, assets with incorrect or missing specifications, and maintenance intervals based on guesswork rather than manufacturer recommendations or operating conditions.
Inadequate parts inventory. Nothing derails planned maintenance faster than discovering you don't have the parts needed for a scheduled job. The technician either skips the task or waits for parts, both of which push work into the reactive category. Many facilities order parts after work is scheduled rather than before, which guarantees delays.
Unrealistic scheduling. Some maintenance managers schedule more work than their team can complete, assuming technicians will work overtime or emergencies won't happen. This approach backfires. When the inevitable emergency occurs, multiple planned tasks get bumped. The backlog grows, and the team falls further behind.
Building an Asset Foundation That Supports Planning
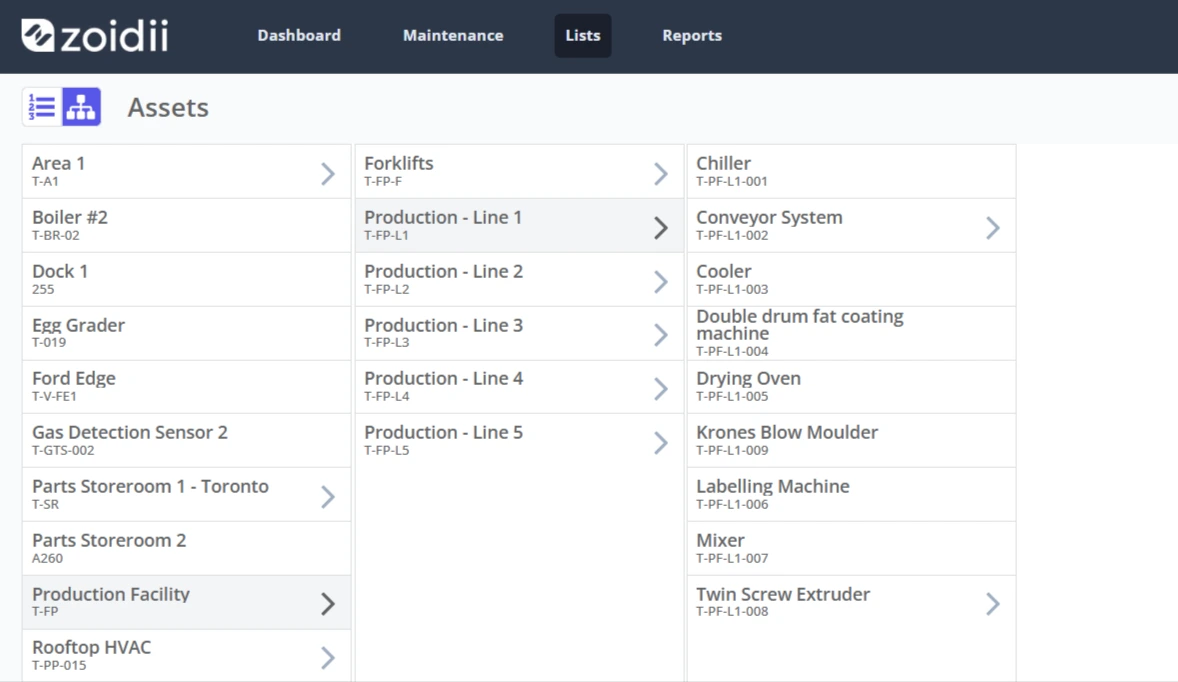
You can't plan maintenance for equipment you don't know about or don't understand. The first step toward higher planned maintenance is creating a complete, accurate asset registry.
This sounds basic, but most facilities have significant gaps. Equipment gets installed without being added to the maintenance system. Assets get modified without documentation updates. Criticality ratings reflect assumptions from years ago rather than current operating conditions.
Start with a physical inventory. Walk every area of your facility and document every piece of equipment that requires maintenance. For each asset, record its location, manufacturer, model number, serial number, installation date, and current condition.
Then assign criticality ratings based on actual operational impact. A piece of equipment is critical if its failure would stop production, create safety hazards, cause environmental violations, or result in significant financial losses. Equipment that can fail without immediate operational impact is less critical.
Criticality determines maintenance priority. Critical equipment needs more frequent inspection, faster response to problems, and more comprehensive spare parts inventory. Non-critical equipment can tolerate longer intervals between maintenance and longer repair times.
This assessment often reveals surprises. Equipment assumed to be critical may have redundancy that makes it less urgent. Equipment considered unimportant may be a single point of failure for an entire production line.
Creating Maintenance Plans That Actually Get Executed
A maintenance plan that sits in a binder or software system without being executed is worthless. Effective plans share several characteristics that make execution practical.
Realistic time estimates. If a task actually takes 90 minutes but the plan allocates 30 minutes, technicians will either rush through it or fall behind schedule. Both outcomes hurt your planned maintenance percentage. Time estimates should include travel time, documentation, and cleanup, not just wrench time.
Complete job packages. Before scheduling any planned maintenance task, ensure you have the parts, tools, procedures, and safety requirements documented and available. A technician should be able to pick up a work order and execute it without hunting for information or waiting for materials.
Appropriate intervals. Maintenance intervals should reflect actual equipment needs, not arbitrary calendar periods. A pump running 24 hours a day in a harsh environment needs a different maintenance frequency than an identical pump running 8 hours a day in clean conditions. Base intervals on manufacturer recommendations adjusted for your operating environment, or better yet, on condition monitoring data.
Clear accountability. Every maintenance task needs an assigned technician or team. Unassigned work tends to drift. When multiple people are theoretically responsible, no one takes ownership.
The most common planning mistake is overcommitting. If your team has 400 available labor hours per week, don't schedule 500 hours of planned maintenance. Leave a buffer for emergencies. A good rule of thumb is scheduling planned work for 80% of available capacity, leaving 20% for reactive work and unexpected issues.
Improving Emergency Response to Protect Planned Work
This seems counterintuitive: to increase planned maintenance, improve your emergency response. The logic becomes clear when you consider what happens during breakdowns.
When an emergency takes longer than necessary, it consumes more labor hours that could have gone to planned work. It also keeps equipment down longer, which may trigger additional failures in connected systems. Fast, effective emergency response minimizes the damage that reactive work does to your planned maintenance schedule.
Several practices accelerate emergency response without requiring additional staff.
Standardized troubleshooting procedures. When a technician encounters a breakdown, they shouldn't start from scratch every time. Document troubleshooting steps for common failures on each piece of equipment. Include probable causes, diagnostic checks, and repair procedures.
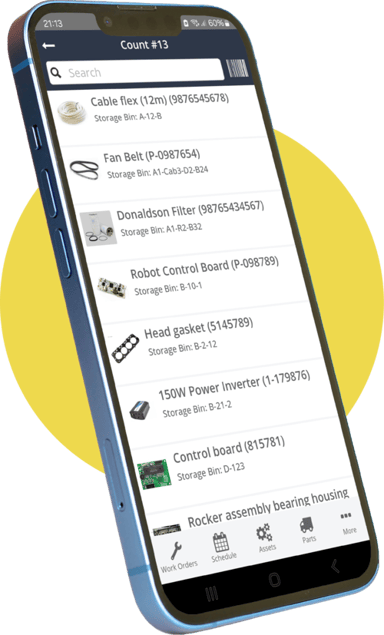
Mobile access to asset information. Technicians troubleshooting equipment need instant access to maintenance history, previous repairs, parts lists, and technical documentation. If they have to walk back to an office to look up information, emergency repairs take longer. Mobile CMMS access puts this information in their hands at the equipment.
Pre-positioned spare parts. For critical equipment, keep common failure parts nearby. A bearing that takes 20 minutes to install shouldn't require a 2-hour wait for someone to retrieve it from a distant storeroom.
Post-failure analysis. After every significant breakdown, document what failed, why it failed, and what could prevent similar failures. This information improves both emergency response for similar future events and preventive maintenance plans.
Using Maintenance Software to Automate and Track
A computerized maintenance management system transforms how maintenance teams plan and execute work. The benefits of increasing your planned maintenance percentage are substantial.
Automated scheduling. CMMS software generates work orders automatically based on time intervals, meter readings, or condition triggers. This eliminates the manual effort of tracking when maintenance is due and ensures nothing falls through the cracks.
Parts integration. Good CMMS platforms link work orders to required parts and check inventory before scheduling. If parts aren't available, the system can delay scheduling until they arrive or alert planners to order them.
Performance tracking. You can't improve what you don't measure. CMMS software tracks planned versus reactive hours automatically, showing trends over time and identifying problem areas.
Workflow management. Work orders move through a defined process from creation to scheduling to assignment to completion. This structure prevents tasks from getting lost and provides visibility into work status.
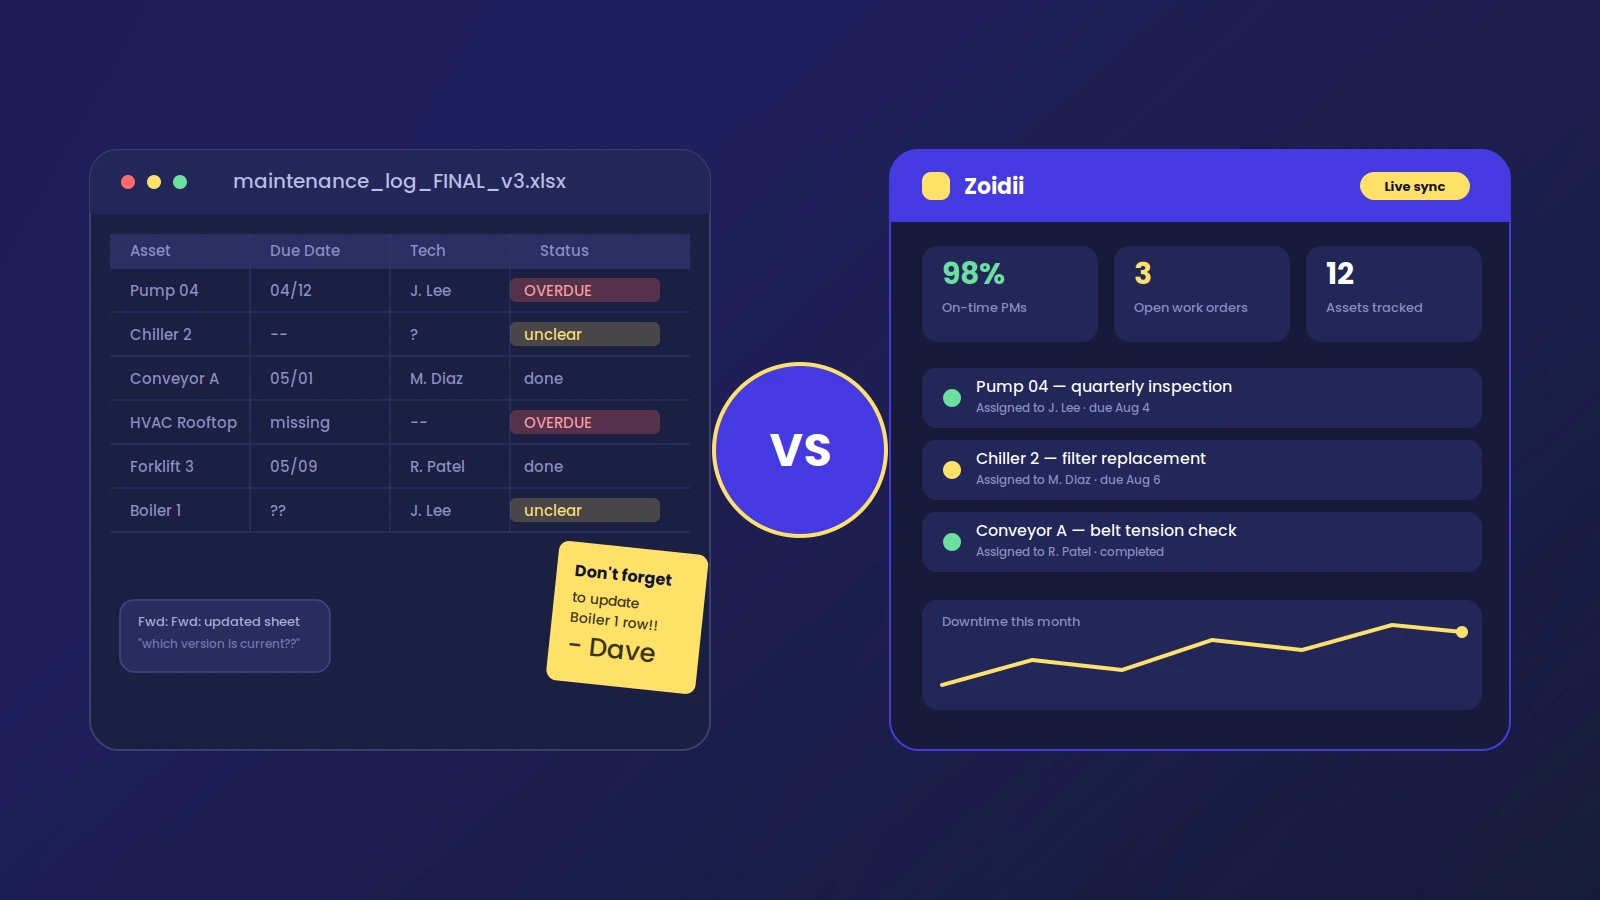
The transition from paper-based or spreadsheet maintenance tracking to CMMS typically takes 3 to 6 months for full implementation. During this period, planned maintenance percentage often dips temporarily as teams learn new systems and clean up data. This is normal. The long-term gains more than compensate.
When selecting CMMS software, prioritize ease of use for technicians. The most feature-rich system provides no value if your team won't use it. Mobile functionality is essential for modern maintenance operations.
Monitoring Performance and Making Adjustments
Increasing your planned maintenance percentage isn't a one-time project. It requires ongoing attention to performance metrics and a willingness to adjust based on what the data shows.
Track these indicators monthly at a minimum.
Planned maintenance percentage itself. Monitor the trend, not just the current number. A facility at 45% that's improving 2 points per month is in better shape than one at 55% that's declining.
Schedule compliance. Of the planned work you scheduled, what percentage actually got completed on time? Low compliance suggests scheduling problems: either too much work scheduled, too many emergencies, or insufficient resources.
Mean time between failures (MTBF). This measures equipment reliability. As planned maintenance percentage increases, MTBF should improve. If it doesn't, your maintenance plans may not be addressing the right failure modes.
Mean time to repair (MTTR). This measures how quickly you resolve failures when they occur. Faster repairs mean less reactive maintenance time, which improves your ratio.
Backlog age. How old is your oldest unfinished work order? Growing backlogs indicate you're falling behind, even if current metrics look acceptable.
When metrics stagnate or decline, investigate the cause before adding resources. Often, the problem is process-related rather than capacity-related. Common issues include poor job planning that makes tasks take longer than estimated, parts availability problems that delay scheduled work, and emergency work that could have been prevented with better inspection practices.
The Real Payoff Beyond the Percentage
Focusing narrowly on the planned maintenance percentage misses the point. The metric matters because of what it represents: control over your maintenance operation and, by extension, your equipment reliability.
Facilities with high planned maintenance percentages experience fewer unexpected breakdowns. Their equipment lasts longer. Their maintenance costs are lower and more predictable. Their production schedules are more reliable. Their technicians are less stressed and more satisfied.
The plant I mentioned at the beginning didn't set out to improve a metric. They set out to stop the chaos of constant breakdowns and emergency repairs. The planned maintenance percentage gave them a way to measure progress toward that goal.
Your path will look different based on your starting point, equipment types, and organizational constraints. But the fundamental approach remains consistent: build complete asset knowledge, create executable maintenance plans, protect planned work from emergency disruption, and continuously monitor and adjust.
Start where you are. Contact Zoidii for a CMMS. Measure accurately. Improve incrementally. The percentage will follow.