
Most maintenance teams are drowning in data but starving for insight. They track everything, understand little, and wonder why equipment keeps failing despite their best efforts.
The problem isn't a lack of information. The problem is tracking the wrong things, or tracking the right things without knowing what the numbers actually mean. Maintenance KPIs should tell a story about your operation. They should reveal patterns, predict problems, and guide decisions. When chosen carefully and monitored consistently, these metrics transform maintenance from a reactive cost center into a strategic advantage.
This guide breaks down the maintenance KPIs that actually matter, explains how to calculate them, and shows you how to turn raw numbers into meaningful action. Whether you're managing a single facility or overseeing maintenance across multiple sites, these indicators will help you understand what's really happening with your equipment and your team.
What Are Key Performance Indicators for Maintenance?
KPIs are measurable values that show how effectively your maintenance operation achieves its objectives. Think of them as vital signs for your equipment and your team's performance.
In maintenance, KPIs provide visibility into three critical areas: how well your assets perform, how efficiently your team operates, and whether your maintenance strategy actually works.
The right KPIs answer specific questions. Are we preventing failures or just reacting to them? How quickly do we restore equipment after breakdowns? Which assets drain the most resources? Are we managing spare parts effectively?
Without these metrics, maintenance managers operate on gut feeling and anecdotal evidence. With them, you can track progress against goals, spot trends before they become crises, and justify budget requests with hard data.
A 2026 survey by Plant Engineering found that facilities actively tracking maintenance KPIs experienced 23% less unplanned downtime than those relying on informal tracking methods. The difference comes down to visibility: you can't improve what you don't measure.
Why Tracking Maintenance KPIs Matters
Maintenance teams that don't track KPIs are essentially flying blind. Here's what proper measurement enables:
Performance visibility becomes possible. KPIs provide quantifiable data to assess both team performance and individual asset health. Without these metrics, determining whether your maintenance strategies work remains guesswork. You might feel busy, but busyness doesn't equal effectiveness.
Weaknesses become visible. Regular KPI review exposes inefficiencies that otherwise hide in plain sight. Your preventive maintenance schedule looks good on paper, but compliance hovers around 60%. Have repair times crept up over the past six months? You won't know without tracking.
Decisions get better. Data-driven decisions beat hunches every time. When you know which assets fail most often, which repairs take longest, and where your team spends its time, you can allocate resources intelligently. That means better scheduling, smarter inventory management, and more targeted training.
Benchmarking becomes meaningful. KPIs let you compare your performance against industry standards or your own historical data. According to the Society for Maintenance and Reliability Professionals, world-class maintenance operations achieve planned maintenance percentages above 85%. Where does your team stand?
Continuous improvement has direction. Tracking KPIs ensures you're always looking for ways to get better. This matters for extending asset life, controlling maintenance costs, and keeping operations safe. Improvement without measurement is just hope.
The Essential Maintenance Metrics
Here are the KPIs that maintenance professionals should prioritize. Each one reveals something different about your operation, and together they paint a complete picture.
1. Planned Maintenance Percentage (PMP)
This metric shows the proportion of maintenance work that's planned versus reactive. The calculation is straightforward: divide planned maintenance work orders by total work orders, then multiply by 100.
A high PMP indicates your team operates proactively. A low PMP means you're constantly fighting fires. Industry benchmarks suggest world-class operations maintain PMP above 85%, while the average facility sits around 55-65%.
Why this matters: Reactive maintenance costs three to five times more than planned maintenance, according to a 2026 analysis by Reliabilityweb.com. Every percentage point improvement in PMP translates directly to cost savings.
If your PMP is below 70%, start investigating why. Common culprits include inadequate preventive maintenance schedules, poor failure analysis, and insufficient spare parts inventory that forces emergency repairs.
2. Preventive Maintenance Compliance (PMC)
PMC measures how well your team sticks to the preventive maintenance schedule. Calculate it by dividing completed PM work orders (finished on time) by total scheduled PM work orders for the period.
This KPI reveals execution discipline. Having a PM schedule means nothing if your team doesn't follow it. Facilities with PMC below 80% typically see higher breakdown rates and shorter equipment life.
The calculation seems simple, but defining "on time" matters. Most organizations use a window: a PM scheduled for the 15th might be considered compliant if completed between the 13th and 17th. Whatever window you choose, apply it consistently.
Low PMC often points to scheduling problems, staffing shortages, or PM tasks that take longer than estimated. Sometimes it indicates that PMs are scheduled too frequently, and the workload isn't achievable with available resources.
3. Mean Time to Repair (MTTR)
MTTR measures the average time needed to diagnose and repair equipment after a failure. Divide the total repair time by the number of repairs during a specific period.
A low MTTR means your team restores equipment quickly, minimizing downtime. A high MTTR suggests problems with technician skills, spare parts availability, or diagnostic processes.
According to Aberdeen Group's 2026 maintenance research, top-performing facilities achieve MTTR under 2 hours for critical equipment, while average performers take 4-6 hours for similar repairs.
Breaking down MTTR into components helps identify improvement opportunities. Total repair time includes response time (how long until a technician arrives), diagnosis time, waiting time for parts, and actual repair time. Each component suggests different interventions.
4. Mean Time Between Failures (MTBF)
MTBF represents the average operating time between equipment failures. Calculate it by dividing the total operating time by the number of failures during that period.
High MTBF indicates reliable equipment with fewer breakdowns. Low MTBF signals reliability problems that need attention.
This metric works best when tracked per asset or asset class. A facility-wide MTBF obscures important details. Your HVAC system might run 8,000 hours between failures, while a particular conveyor fails every 200 hours. That conveyor needs investigation.
Tracking MTBF over time reveals trends. If an asset's MTBF is declining, it may be approaching the end of its life or experiencing accelerated wear due to operating conditions. If MTBF improves after a maintenance intervention, you've validated that approach.
5. Asset Heavy Hitters
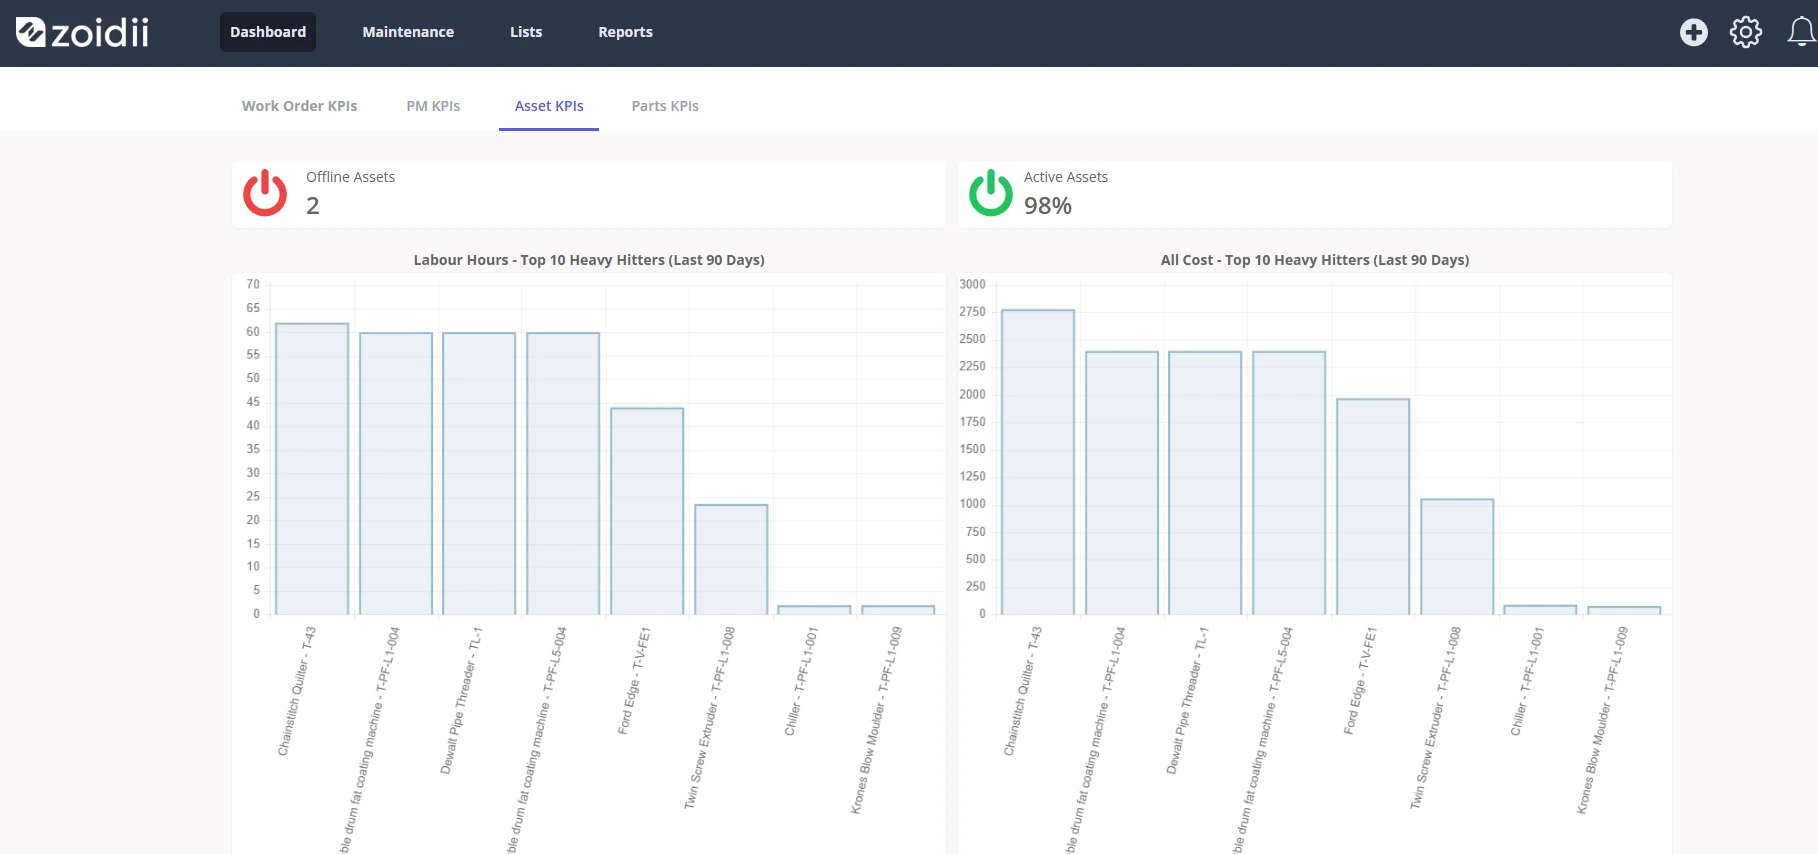
This KPI identifies assets consuming the most maintenance resources, whether measured by cost, labor hours, or frequency of work orders.
Understanding your heavy hitters enables informed decisions. Should you replace that aging compressor that's consumed $47,000 in repairs over the past 18 months? The data makes the case clearer than any subjective assessment.
Heavy hitter analysis often reveals surprising patterns. Sometimes a relatively new asset becomes a heavy hitter due to installation problems or operating conditions. Sometimes, an old asset that "everyone knows" is problematic actually costs less than assumed.
Run this analysis quarterly. Rank assets by total maintenance cost, by work order count, and by downtime caused. The assets appearing on multiple lists deserve immediate attention.
6. Stock Turns
This KPI measures how often maintenance inventory is used and replaced. Divide the cost of parts used on work orders by the average inventory value for the period.
Higher stock turns indicate efficient inventory management. Low turns suggest overstocking, obsolete parts, or poor inventory planning.
According to the 2026 MRO inventory benchmark study by APQC, top-performing maintenance operations achieve 2-3 stock turns annually, while average performers manage 0.8-1.2 turns.
Stock turns balance against parts availability. Extremely high turns indicate insufficient inventory that leads to stockouts and extended downtime. The goal is optimization, not minimization.
Track slow-moving inventory separately. Parts sitting untouched for 12+ months tie up capital and may become obsolete. Consider whether these parts are truly needed or if they were ordered for equipment that's since been replaced.
How a CMMS Helps Track These KPIs
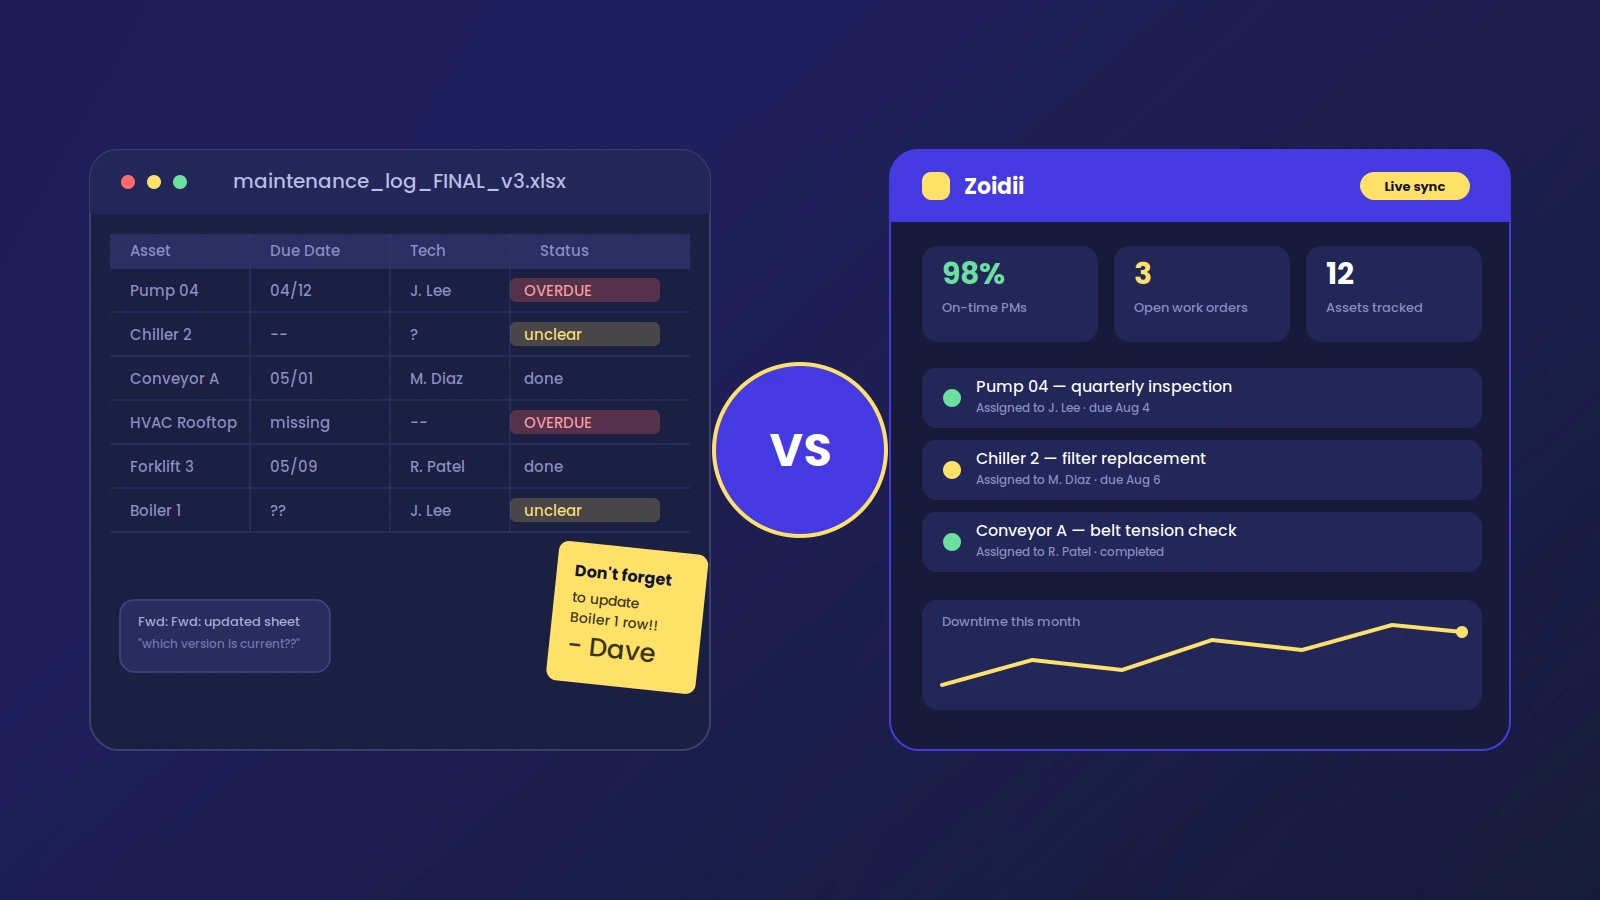
Manual KPI tracking is technically possible but practically unsustainable. Spreadsheets become unwieldy, data entry falls behind, and the numbers quickly become unreliable.
A Computerized Maintenance Management System automates the heavy lifting. Here's what that looks like in practice:
Data collection happens automatically. Every work order, every repair, every parts transaction gets recorded. Technicians enter information as part of their normal workflow, not as a separate reporting task. This eliminates the data gaps that plague manual tracking.
Real-time visibility replaces monthly reports. With a CMMS, managers see current KPI performance whenever they need it. If MTTR spikes on Tuesday, you know Tuesday, not three weeks later when someone compiles the monthly report.
Dashboards centralize key metrics. Modern CMMS platforms display critical KPIs in configurable dashboards. Maintenance managers, plant managers, and executives can each see the metrics most relevant to their role.
Trend analysis reveals patterns. A CMMS stores historical data and can generate reports showing how KPIs change over time. This enables prediction: if MTBF for a particular asset class has declined 15% over six months, you can anticipate future failures and plan accordingly.
Work order management supports PMC tracking. The system knows what's scheduled, what's completed, and what's overdue. Calculating preventive maintenance compliance becomes automatic rather than a manual counting exercise.
Inventory integration enables stock turn analysis. When parts usage ties directly to work orders, calculating stock turns requires no additional effort. The CMMS knows what was used, when, and for what purpose.
The 2026 CMMS Market Report from Software Advice found that organizations implementing CMMS software saw an average 28% improvement in maintenance KPIs within the first year. The improvement comes primarily from better data quality and faster response to emerging issues.
Making KPIs Actionable
Tracking KPIs without acting on them wastes everyone's time. Here's how to turn metrics into improvements:
Set targets based on your current baseline. If your PMP is 52%, aiming for 90% next quarter is unrealistic. Target 60%, achieve it, then raise the bar.
Review KPIs at consistent intervals. Weekly reviews for operational metrics like MTTR and PMC make sense. Monthly or quarterly reviews work better for strategic metrics like heavy-hitter analysis.
Investigate anomalies immediately. When a KPI moves significantly in either direction, find out why. Sudden improvements might indicate data quality issues. Sudden declines signal emerging problems.
Connect KPIs to root causes. A low PMC score is a symptom, not a diagnosis. Dig into why PMs aren't getting completed. Is it scheduling? Staffing? Parts availability? Each cause requires a different solution.
Share KPIs with your team. Technicians who understand how their work affects metrics make better decisions, and when the team knows that completing PMs on time matters, compliance improves.
Building a KPI-Driven Maintenance Culture
The maintenance KPIs outlined here provide a foundation for understanding and improving your operation. Planned Maintenance Percentage shows whether you're proactive or reactive. Preventive Maintenance Compliance reveals execution discipline. MTTR and MTBF measure repair efficiency and equipment reliability. Heavy hitter analysis identifies resource drains. Stock turns ensure inventory supports rather than hinders maintenance work.
Start with the basics. If you're not currently tracking any of these metrics, pick two or three and build from there. Accurate data on a few KPIs beats unreliable data on many.
Zoidii's CMMS makes tracking these maintenance KPIs straightforward, with automated data collection, real-time dashboards, and reporting tools that turn raw numbers into actionable insights. See how it works by booking a demo today.