
The average manufacturing plant spends between 15 and 40 percent of its total annual operating budget on maintenance. Yet research shows that only 24.5 percent of a technician's paid shift involves actual repair work. The remaining 75.5 percent is consumed by travel, parts hunting, paperwork, waiting for information, and chasing approvals.
That gap between what maintenance costs and what it actually delivers is where operational improvement lives. And in 2026, the most reliable path to closing that gap runs directly through a Computerized Maintenance Management System (CMMS).
This article breaks down the six highest-impact areas of maintenance operational improvement, the data behind each one, and how CMMS software delivers measurable results in every category without adding headcount or compressing margins.
Key Takeaways
Reactive maintenance is the single most expensive operational choice. Facilities without structured CMMS typically spend 60 to 80 percent of maintenance effort on reactive work. World-class operations run at 85 to 90 percent planned maintenance. Emergency repairs cost 3 to 5 times more than the same repair done on a schedule, and shifting from 70 percent reactive to 70 percent planned reduces total corrective maintenance spending by 25 to 40 percent.
Wrench time improvement is the fastest ROI in maintenance. Only 24.5 percent of a technician's shift involves actual repair work today. A mobile-first CMMS with digital work orders, pre-loaded procedures, and real-time parts visibility raises productive wrench time above 55 percent, effectively doubling output without a single new hire.
Downtime costs are accelerating. Siemens' True Cost of Downtime report puts the average large plant loss at $253 million per year, up 65 percent from 2019. Across the Fortune Global 500, unplanned failures cost $1.4 trillion annually. CMMS-driven preventive maintenance programs reduce unplanned downtime by 25 to 50 percent in the first year.
Spare parts are a hidden cost center. 47 percent of extended repair time traces back to parts unavailability, not technician skill. Facilities with CMMS-driven inventory management report 40 percent lower parts expenditure and 58 percent faster repair completion compared to those running on spreadsheets and tribal knowledge.
CMMS ROI is documented and substantial. Facilities deploying CMMS in 2026 are documenting 30 to 45 percent lower total maintenance costs. Most manufacturing operations achieve positive ROI within 6 to 9 months, with comprehensive returns of 300 to 500 percent over 18 to 24 months.
Why Operational Improvement Has to Start with Maintenance
Maintenance is often treated as a cost center to be managed down rather than a performance lever to be optimized. That framing is increasingly difficult to defend when the numbers are examined closely.
Unplanned downtime costs the average manufacturing facility $260,000 per hour. The Siemens True Cost of Downtime report quantifies the average large plant loss at $253 million per year, a figure that has risen 65 percent since 2019. Over 80 percent of manufacturers admit they cannot accurately calculate their own downtime costs, which means the true exposure is almost certainly worse than what gets reported to leadership.
Meanwhile, over half of manufacturing sites are still running primarily reactive maintenance operations. Organizations at the lowest levels of maintenance maturity experience 30 to 50 percent more downtime than world-class operations and pay 3 to 5 times more per operating hour as a result. The operational improvement opportunity is significant. The question is not whether better maintenance management generates returns. It is how to capture those returns systematically. That is precisely what a CMMS is designed to do.
1. Shift from Reactive to Preventive Maintenance
The most fundamental operational improvement available to any maintenance team is changing the ratio of reactive to planned work. Every metric improves when this ratio shifts: downtime falls, repair costs drop, asset life extends, and labor becomes more productive.
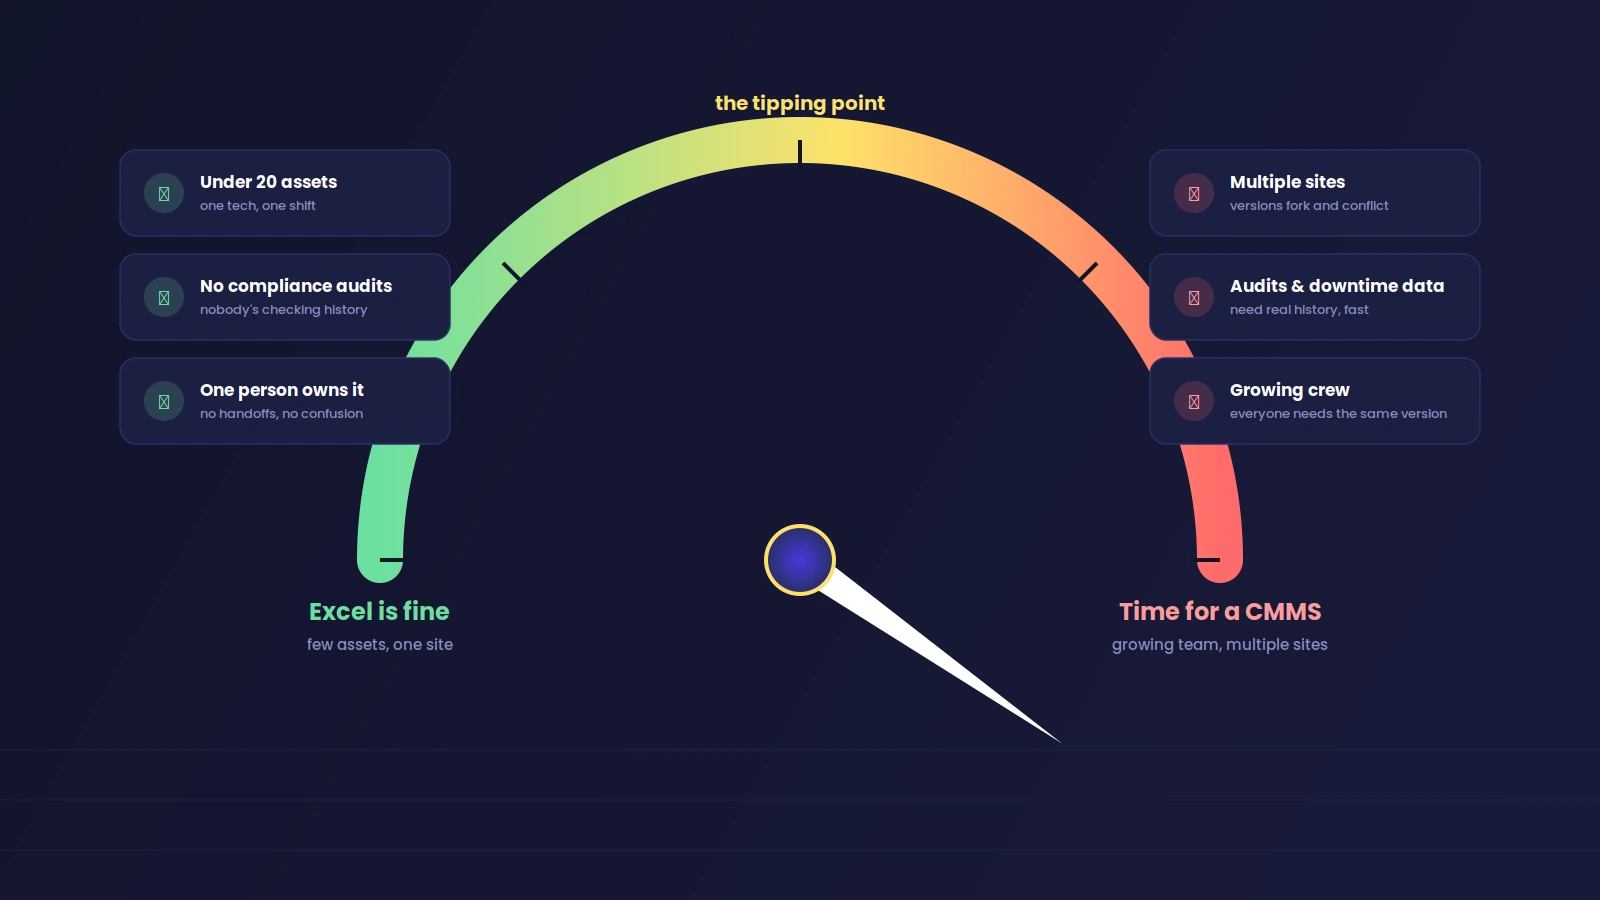
Without a CMMS, most teams are structurally trapped in reactive mode. Work orders arrive ad hoc. Priorities are set by whoever shouts loudest or by which asset fails most visibly. There is no systematic way to schedule and track preventive maintenance across a large asset base.
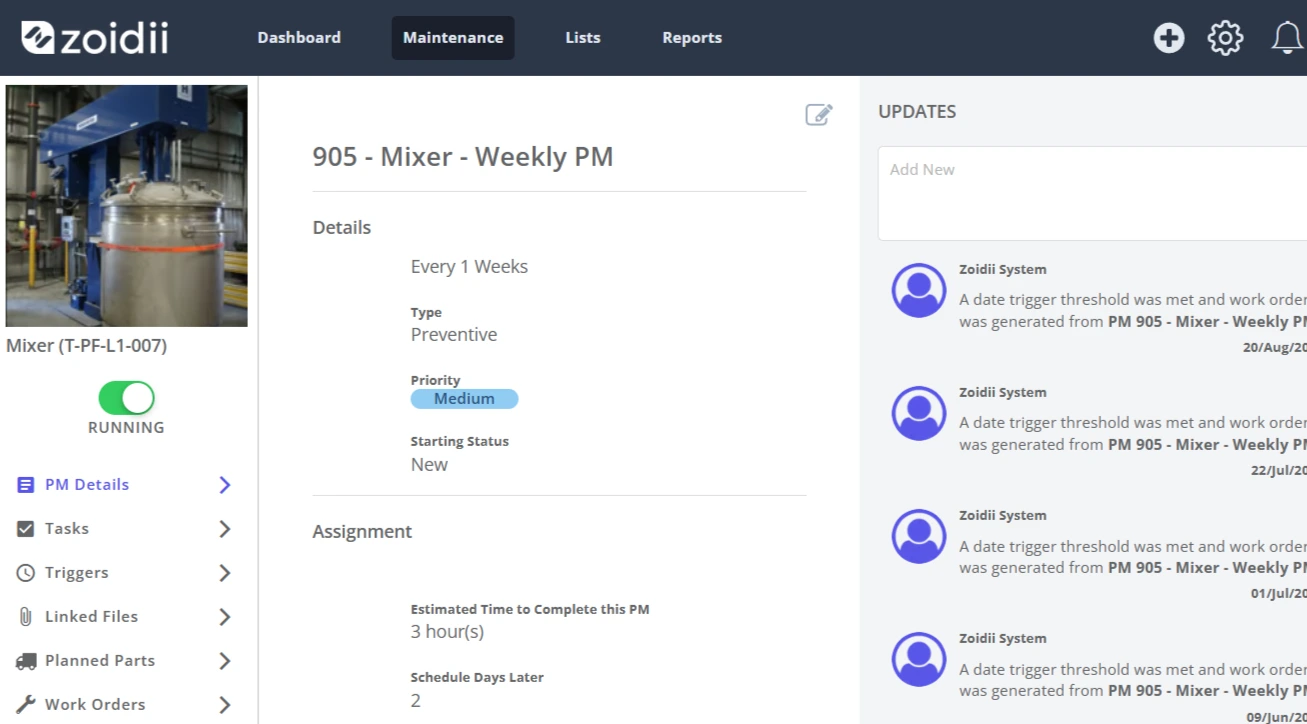
A CMMS changes this directly. Preventive maintenance tasks are scheduled automatically based on calendar intervals, operating hours, or condition-based triggers. Assignments are generated before failures occur. Completion is tracked with mandatory sign-off, and overdue PMs escalate automatically rather than disappearing into a backlog.
The results are documented and consistent. CMMS-driven PM programs reduce unplanned downtime by 25 to 50 percent in the first year. Research indicates that 60 to 70 percent of unplanned failures are caused by missed inspections, meaning that structured PM alone eliminates the majority of reactive work most teams are currently absorbing.
Calendar-based preventive maintenance is the first step. The next is condition-based maintenance, where maintenance is triggered by actual asset condition rather than the calendar. Facilities that have implemented CMMS-integrated condition monitoring achieve PM compliance rates of 89 percent or higher and sustain unplanned downtime below the 5 percent world-class threshold. The shift in economics is substantial. Emergency repairs carry a 3 to 5 times cost premium over planned repairs, combining overtime labor, expedited parts sourcing, collateral damage to adjacent components, and the productivity cost of working under production pressure. Shifting the maintenance mix from 70 percent reactive to 70 percent planned reduces total corrective maintenance spending by 25 to 40 percent.
2. Recover Lost Wrench Time Through Smarter Work Order Management
Only 24.5 percent of a maintenance technician's paid shift currently involves actual repair work. That is the industry average from 2026 benchmark data. The remaining 75.5 percent is absorbed by activities that have nothing to do with fixing equipment: walking to and from the office, searching for manuals and procedures, waiting for parts, getting supervisor approvals, and completing end-of-day paperwork.
This is not a technician performance problem. It is a systems and information problem. Technicians spend time on non-productive activities because the information they need is not where they are, and the parts they need are not ready when they arrive.
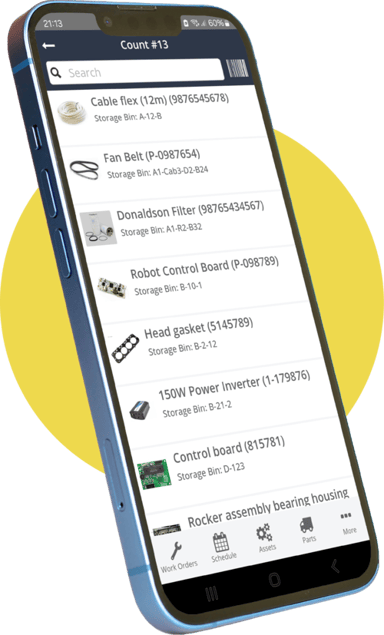
A CMMS with mobile access directly attacks this problem. Digital work orders with pre-loaded procedures, asset histories, LOTO requirements, and parts lists mean that technicians arrive at the job site fully prepared rather than half-informed. Mobile work order closure eliminates end-of-day paperwork sessions. Real-time parts inventory visibility confirms availability before dispatch rather than after arrival.
The result: mobile-first CMMS platforms raise productive wrench time from the industry average of 25 to 35 percent to 55 percent or higher. For a team of 10 technicians at $85,000 average cost, a 35 percent productivity gain recovers approximately $297,500 in labor value annually without a single additional hire. Well-designed CMMS work order management also standardizes the information captured at job completion: failure codes, parts consumed, labor hours, and asset condition notes. This consistent data capture is what enables every other improvement in the operational improvement stack. Without it, trend analysis, root cause identification, and predictive maintenance are all impossible.
3. Control Maintenance Costs Through Spare Parts Optimization
Spare parts inventory is one of the most significant and least visible sources of maintenance cost inefficiency. Stockouts force emergency procurement at a 30 to 40 percent premium over standard pricing and extend MTTR by hours or days. Overstocking ties up capital in obsolete or slow-moving inventory that degrades over time. Most maintenance operations manage both problems simultaneously without realizing it.
Research shows that 47 percent of extended repair time is attributable to parts unavailability rather than repair complexity. And McKinsey's 2025 data indicates that CMMS-driven min-max inventory automation reduces MRO spending by 15 percent on average through the elimination of emergency sourcing and capital-inefficient overstocking.
Facilities that have implemented CMMS-driven parts management with a structured ABC analysis report 40 percent lower parts expenditure and 58 percent faster repair completion compared to those running manual inventory processes.
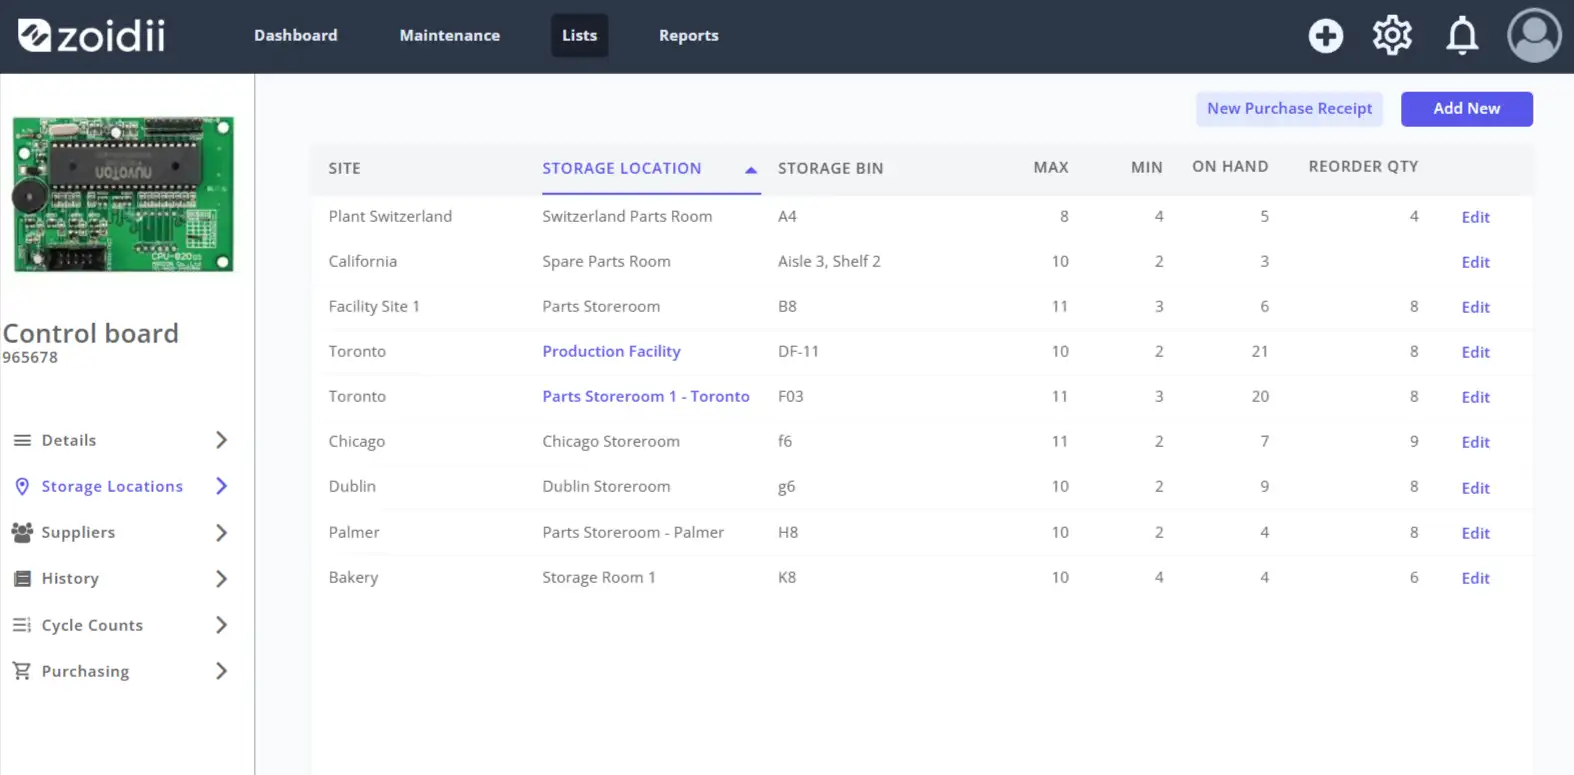
The mechanism is straightforward. A CMMS links every spare part to the assets it serves. Consumption is recorded automatically when parts are used on work orders. Minimum and maximum stock levels are configured per part, and reorder triggers fire automatically when inventory falls below the minimum. Emergency sourcing becomes rare because parts are restocked before shortages occur rather than after they cause a repair delay.
ABC analysis, built into modern CMMS platforms, separates parts into three tiers based on usage frequency and criticality. High-value, fast-moving parts (A items) receive tight inventory control and shorter reorder cycles. Low-value, slow-moving parts (C items) are stocked leanly or sourced on demand. This tiered approach concentrates inventory investment where it generates the most operational value rather than spreading it uniformly across thousands of SKUs.
The CMMS also enables purchase history analysis that surfaces vendor performance issues, identifies substitute parts opportunities, and supports negotiations with suppliers through documented volume and usage data.
4. Extend Asset Life and Defer Capital Expenditure
Every major capital asset has a theoretical useful life and an actual useful life. The gap between them is almost entirely determined by the quality of maintenance the asset receives. Equipment that is consistently serviced according to manufacturer specifications, monitored for early signs of deterioration, and repaired promptly when minor issues are detected routinely outlasts its design life. Equipment that is run until failure degrades much faster.
McKinsey research finds that predictive maintenance strategies increase asset life by 20 to 40 percent compared to reactive approaches. For a facility with $5 million in capital equipment under management, a 25 percent life extension means $1.25 million in deferred replacement costs. That number belongs in every CMMS business case presented to a CFO or capital planning committee.
A CMMS enables this life extension in several concrete ways.
Complete asset maintenance histories give engineering teams the documented performance data needed to make evidence-based repair-versus-replace decisions rather than defaulting to gut feel or capital budget cycles. Equipment that has been consistently maintained and shows stable performance can justify extended service. Equipment with deteriorating MTBF trends or escalating repair costs can be flagged for proactive replacement before a catastrophic failure occurs.
Condition-based maintenance, enabled by CMMS integration with IoT sensors and condition monitoring equipment, detects deterioration early. A bearing running warm, a pump drawing slightly more current, a motor with elevated vibration: each of these signals precedes failure by weeks or months when monitored properly. CMMS platforms that receive and act on these signals generate work orders for corrective action before failure occurs, preventing the cascade damage that turns a $400 bearing replacement into a $40,000 motor rebuild. Lubrication and calibration compliance, tracked through recurring work orders in the CMMS, prevent the accelerated wear that accounts for a significant proportion of premature equipment failures. Equipment running slightly out of calibration produces a defective product before it fails mechanically. Condition-based maintenance that keeps machines in specification reduces scrap rates by 15 to 25 percent and improves first-pass yield, a financial benefit that compounds across every production run.
5. Improve Labor Productivity and Workforce Planning
Maintenance labor is typically the largest single line item in a maintenance budget, often representing 40 to 60 percent of total maintenance spend. It is also one of the most difficult to plan and allocate effectively without good data.
Without a CMMS, labor planning in maintenance is essentially intuitive. Managers assign work based on who is available, who has relevant experience from memory, and what seems most urgent. There is no systematic way to balance workloads across shifts, match task complexity to technician skill level, or identify where labor hours are being consumed most intensively.
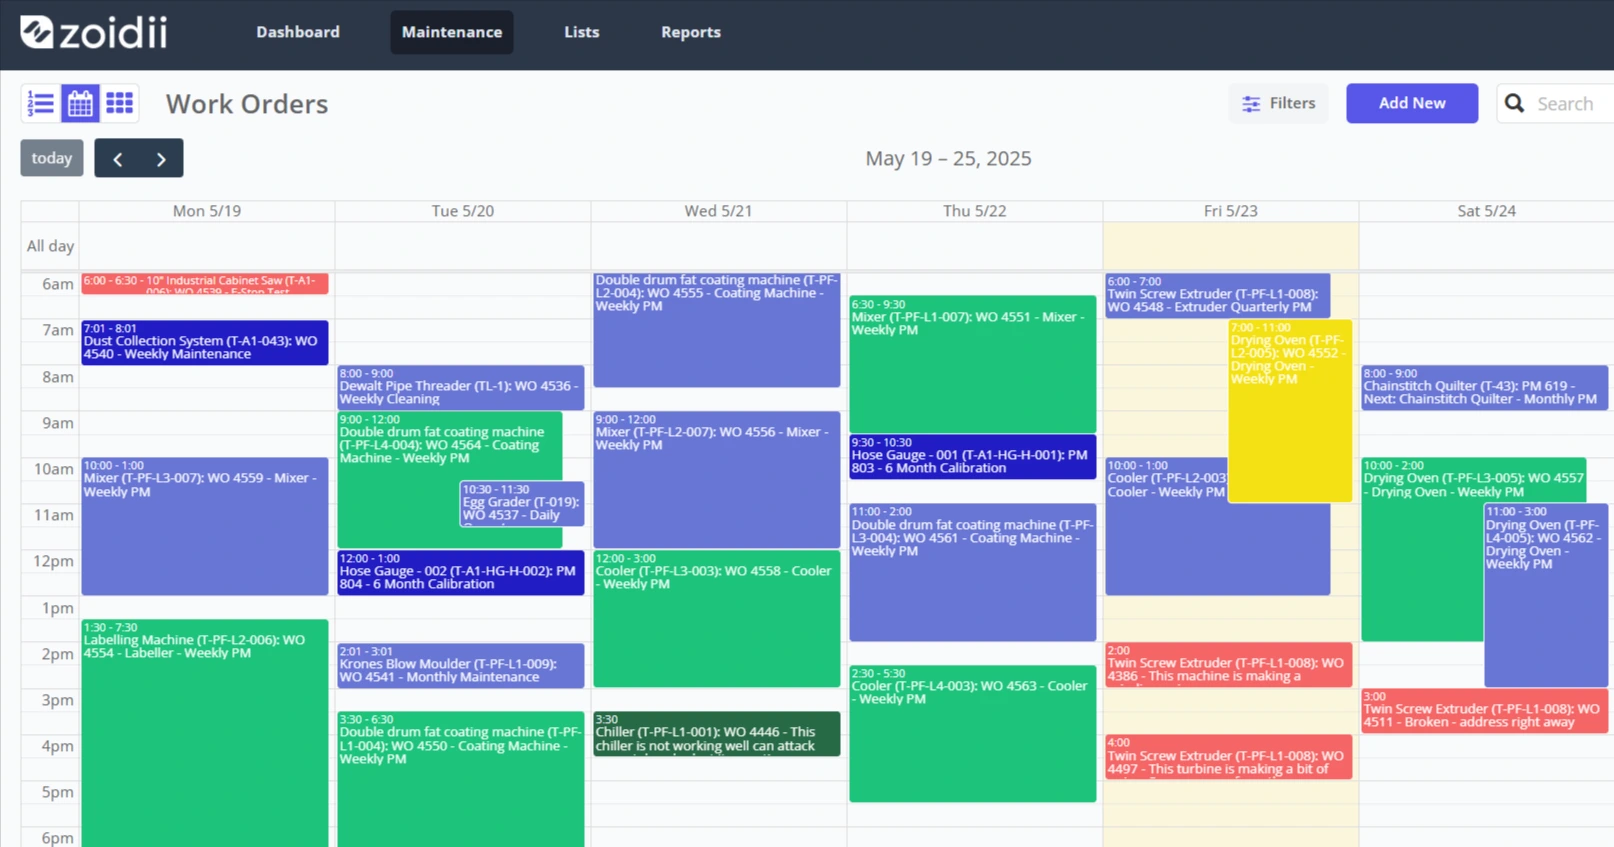
A CMMS structures labor management at every level. Work orders are assigned based on documented technician skills and certifications, ensuring that qualified personnel are dispatched to complex or safety-critical tasks. Workload visibility across the team prevents the chronic imbalance where some technicians are overwhelmed, and others are underutilized. Time tracking on work orders provides an accurate record of where labor hours are going, enabling managers to identify inefficiencies in scheduling, routing, or task sequencing.
The wrench time improvement discussed above compounds across the entire labor force. Moving from 25 percent to 55 percent productive wrench time through mobile tools, pre-staged parts, and digital procedures effectively doubles productive output from existing staff. This is particularly valuable in 2026, when skilled technician shortages are one of the top-cited operational challenges in industrial maintenance, and hiring timelines for experienced personnel run three to six months or longer. Knowledge retention is also a labor productivity issue that CMMS software directly addresses. As experienced technicians retire or move on, they take institutional knowledge about assets, failure modes, and repair procedures with them. A CMMS that captures detailed work order notes, failure codes, and repair histories codifies that knowledge into the system where it remains accessible regardless of personnel changes. New technicians can access the documented repair history of an asset and benefit from the experience of every technician who worked on it before them.
6. Enable Data-Driven Decision Making Across Maintenance Operations
Every operational improvement in this article has one thing in common: it requires data to implement and sustain. Without accurate, consistent records of what work is being done, how long it takes, what it costs, and what outcomes it produces, improvement programs cannot be targeted, measured, or validated.
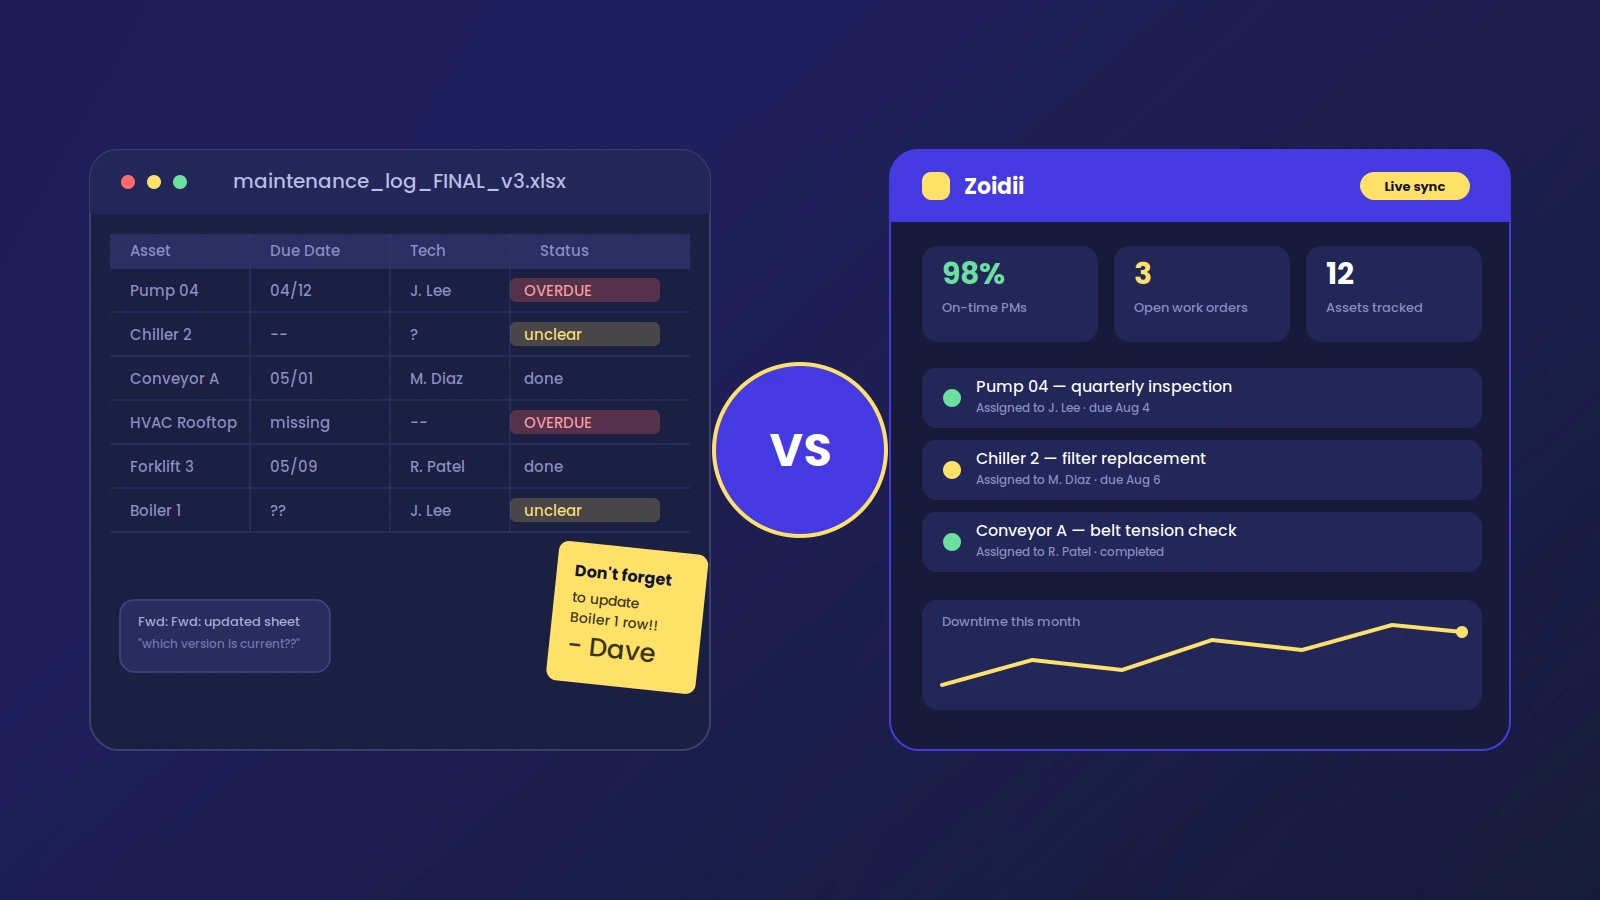
Most maintenance teams are data-poor, not because they lack sophisticated tools, but because the data they need is scattered across paper logs, spreadsheets, email threads, and the memory of individual technicians. When the CMMS is the system of record for all maintenance activity, that fragmentation ends.
Every work order closed in a CMMS contributes to a growing body of operational intelligence: MTBF and MTTR by asset, PM compliance rates, cost per repair, technician productivity, parts consumption, planned versus unplanned ratios, and downtime by cause and asset class. Over time, this data enables improvements that cannot be identified through intuition or observation alone.
Pareto analysis of failure data consistently reveals that a small number of assets drive a disproportionate share of downtime. In most facilities, roughly 20 percent of assets generate 80 percent of downtime costs. Identifying these assets and targeting them with enhanced maintenance strategies, whether that means more frequent PMs, condition monitoring, or design modifications, delivers concentrated improvement with focused resource investment.
Businesses that have implemented structured CMMS reporting and acted systematically on the data report a 15 percent improvement in Overall Equipment Effectiveness (OEE) within the first two years. For facilities currently operating at the industry average OEE of 60 percent against a world-class target of 85 percent, each percentage point recovered through data-driven maintenance improvement translates directly into additional production capacity at zero capital cost.
The same data infrastructure supports financial reporting and capital planning. CFOs and operations leaders increasingly expect maintenance to justify its budget through documented performance metrics. A CMMS that generates clear reports on downtime prevented, cost per work order, PM compliance rates, and asset health status gives maintenance managers the evidence they need to defend budgets, justify investments, and demonstrate the financial value of a well-run maintenance program.
Building an Operational Improvement Roadmap with CMMS
Operational improvement in maintenance is not a single initiative. It is a maturity progression, and each stage builds on the one before it.
Stage 1: Foundation (months 1 to 3). Register all assets in the CMMS with specifications, failure modes, and maintenance requirements. Begin capturing all maintenance activity digitally, including reactive repairs. Establish baseline metrics for MTBF, MTTR, and planned versus unplanned ratios.
Stage 2: Preventive Maintenance (months 3 to 6). Build and activate PM schedules for all critical assets based on manufacturer recommendations and initial failure data. Configure automated scheduling and escalation for overdue PMs. Target 70 percent or higher PM compliance within the first 90 days of activation. Begin tracking wrench time and identifying the top causes of non-productive technician time.
Stage 3: Inventory Optimization (months 4 to 8). Conduct an ABC analysis on parts inventory. Link all parts to the assets they serve. Configure minimum and maximum stock levels with automated reorder triggers. Eliminate emergency sourcing by ensuring critical spares are always available before failures occur.
Stage 4: Performance Analysis (ongoing from month 6). Begin running monthly Pareto analysis on downtime data to identify the assets and failure modes generating the most cost and disruption. Adjust PM programs based on actual failure history rather than manufacturer defaults alone. Track trends in MTBF, MTTR, and planned maintenance ratios and set quarterly improvement targets.
Stage 5: Predictive and Condition-Based Maintenance (months 9 to 18). Integrate condition monitoring on the highest-impact assets identified through Pareto analysis. Configure CMMS alerts for anomalous sensor readings that automatically generate corrective work orders. Target this investment at the 10 to 20 percent of assets driving 80 percent of downtime risk. Each stage delivers its own measurable returns. Teams that complete all five stages within 18 months consistently achieve the documented 300 to 500 percent ROI benchmarks associated with mature CMMS deployments, with the largest gains coming from downtime reduction and labor productivity improvement in the first year.
Frequently Asked Questions
What is maintenance operational improvement and how does CMMS enable it? Maintenance operational improvement is the systematic reduction of maintenance costs, unplanned downtime, and labor waste through better processes, data, and tools. A CMMS enables it by centralizing all maintenance activity in a single system, automating preventive maintenance scheduling, optimizing spare parts inventory, improving technician productivity through mobile work orders, and generating the performance data needed to identify and target the highest-impact improvement opportunities.
How much does a CMMS reduce maintenance costs? Facilities deploying CMMS in 2026 are documenting 30 to 45 percent lower total maintenance costs. The savings come from five primary sources: reduced unplanned downtime (25 to 50 percent reduction in the first year), lower emergency repair premiums from shifting to planned work, improved wrench time productivity (from around 25 percent to 55 percent or higher), reduced parts expenditure through inventory optimization (15 percent average MRO cost reduction), and extended asset life that defers capital replacement.
What is wrench time and why does it matter for operational improvement? Wrench time is the percentage of a maintenance technician's paid shift spent on actual repair work. Industry benchmarks put the average at 24.5 percent, meaning that non-productive activities consume more than three-quarters of every paid hour. A mobile-first CMMS with digital work orders, pre-loaded procedures, and real-time parts visibility raises wrench time above 55 percent, effectively doubling productive output from existing staff without additional headcount.
How quickly does CMMS deliver ROI on maintenance operations? Most manufacturing facilities achieve positive CMMS ROI within 6 to 9 months, driven primarily by reductions in emergency repair premiums and overtime labor as planned maintenance compliance improves. Full ROI realization typically occurs over 18 to 36 months as preventive maintenance programs mature, spare parts inventory stabilizes, and data-driven improvement cycles begin compounding. Comprehensive 5-year returns of 300 to 500 percent are well documented across industrial CMMS deployments.
What is the difference between preventive and predictive maintenance in a CMMS? Preventive maintenance is scheduled based on time intervals or usage thresholds. It runs on a calendar or meter-based trigger regardless of actual asset condition. Predictive maintenance is triggered by actual asset condition data from sensors, monitoring equipment, or pattern analysis of historical work order data. Both are managed and scheduled through a CMMS, but predictive maintenance requires condition monitoring inputs. Preventive maintenance is the first stage; predictive builds on it once sufficient asset history and monitoring infrastructure are in place. Predictive strategies can cut maintenance costs by up to 25 percent and boost uptime by 10 to 20 percent compared to calendar-based PM alone.
How does a CMMS improve spare parts inventory management? A CMMS links every spare part to the assets it serves, tracks consumption automatically from work order closures, and generates reorder alerts when inventory falls below minimum levels. ABC analysis within the CMMS categorizes parts by criticality and usage frequency, concentrating inventory investment where it generates the most operational value. Facilities with CMMS-driven inventory programs report 40 percent lower parts expenditure and 58 percent faster repair completion compared to manual inventory processes.
Ready to drive real operational improvement in your maintenance program? Zoidii CMMS gives maintenance teams the tools to shift from reactive to preventive, recover lost wrench time, optimize parts inventory, and build the data foundation for continuous improvement. Start your free trial today.