
Most facility managers already know they should be tracking KPIs. The problem isn't awareness - it's knowing which metrics genuinely move the needle versus which ones look nice on a quarterly report. After years of watching maintenance teams drown in spreadsheets or, worse, fly blind with no data at all, the difference between high-performing facilities and struggling ones almost always comes down to a handful of well-tracked indicators.
Here's the real talk on the top KPIs for facility managers, how CMMS platforms track them, and what to actually do with the numbers once you have them.
Quick Verdict
If you're short on time, focus on six core KPIs - work order resolution time, preventive maintenance compliance, equipment downtime, maintenance cost per asset, planned vs. reactive maintenance ratio, and mean time to repair. A CMMS automates the collection and reporting of all six. Without one, you're guessing. With one, you can cut reactive maintenance by 30-50% and extend asset life by 20% or more. The rest of this article explains exactly how.
1. Work Order Resolution Time
This metric tracks the clock from the moment a work order is created to when it's marked complete. Simple concept, but the implications are huge. A facility running an average resolution time of 4 hours for priority-one requests is operating very differently from one averaging 48 hours. The gap between those two numbers tells you about staffing levels, parts availability, communication breakdowns, and whether your team is spending too much time on low-priority tasks while critical systems sit idle.
What a CMMS does here
Every work order gets an automatic timestamp at creation, assignment, each status change, and closure. You can slice this data by technician, building, asset type, priority level, or vendor.Benchmark to aim for: Industry data from IFMA suggests top-performing facilities resolve 90% of routine work orders within 24 hours and emergency requests within 4 hours.
2. Preventive Maintenance Compliance (PMC)
PMC is the percentage of scheduled preventive maintenance tasks completed on time. If you scheduled 100 PM tasks this month and completed 85, your PMC is 85%.
PMC is the single most important KPI for any facility manager. A PMC below 80% almost guarantees you'll see rising emergency repair costs within 6-12 months. The math is straightforward: every dollar spent on preventive maintenance saves between $4 and $5 in reactive repairs, according to data from the U.S. Department of Energy.
What a CMMS does here
A CMMS schedules PM tasks based on calendar intervals, equipment runtime hours, or meter readings. It sends reminders before tasks are due, escalates overdue items, and generates compliance reports automatically. You stop relying on someone remembering to check the HVAC filter schedule - the system handles it. Benchmark to aim for: 90% or higher. Anything below 80% signals a maintenance program that's falling behind.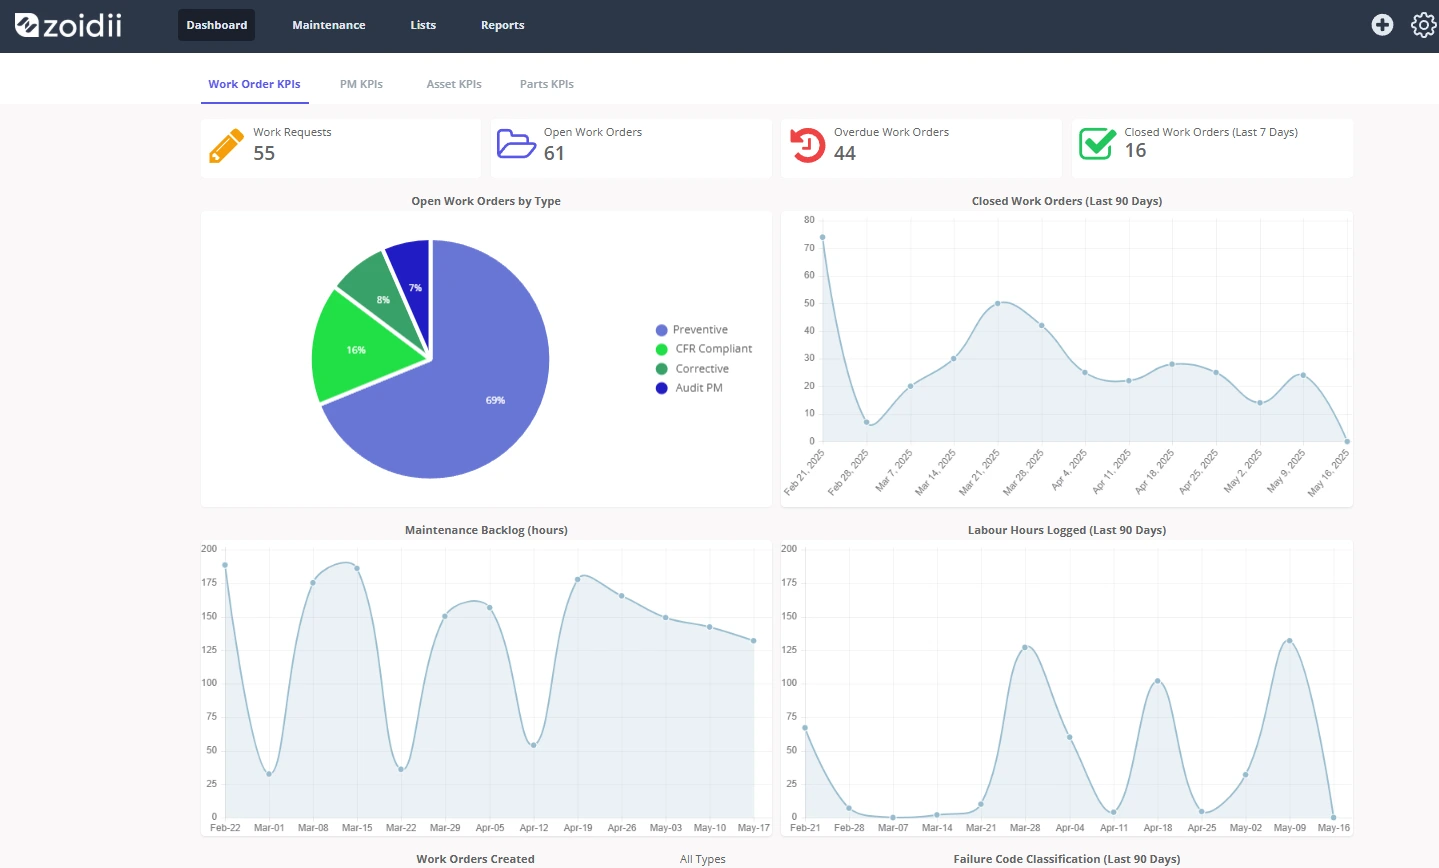
3. Equipment Downtime
Downtime measures the total hours an asset is non-operational. This includes both planned downtime (scheduled maintenance windows) and unplanned downtime (breakdowns). The ratio between the two matters enormously.
A facility where 70% of downtime is planned and 30% is unplanned is in decent shape. Flip those numbers, and you've got a reactive maintenance crisis that's costing 2-3x what it should.
What a CMMS does here
The system logs downtime start and end times, categorizes each event, and ties it to specific root causes. Over months, you build a clear picture of which assets fail most often and why. Some CMMS platforms integrate with IoT sensors to capture downtime automatically, without anyone needing to log it manually.Real-world example: A 200,000 sq. ft. commercial office building tracked elevator downtime through its CMMS for six months. The data showed one elevator averaging 14 hours of unplanned downtime per month - three times the other units. Root cause analysis revealed a failing motor controller. Replacing the $3,200 part eliminated roughly $18,000 in annual emergency repair calls.
4. Maintenance Cost Per Asset (The "Heavy Hitters" Report)
This KPI ranks your assets by total maintenance cost: labor, parts, contractor fees, everything. Facility managers sometimes call the worst offenders "heavy hitters" - the top 10 assets eating your budget alive.
Knowing which assets cost the most isn't just about budgeting. It directly informs repair-vs-replace decisions. If an aging chiller has consumed $45,000 in maintenance over two years and a replacement costs $120,000 with a 15-year expected life, the financial case for replacement becomes clear quickly.
What a CMMS does here
Every work order links to a specific asset, and every work order carries cost data: technician hours, parts used and vendor invoices. The CMMS aggregates this automatically and can generate ranked reports showing your most expensive assets over any time period. No more digging through filing cabinets or reconciling spreadsheets.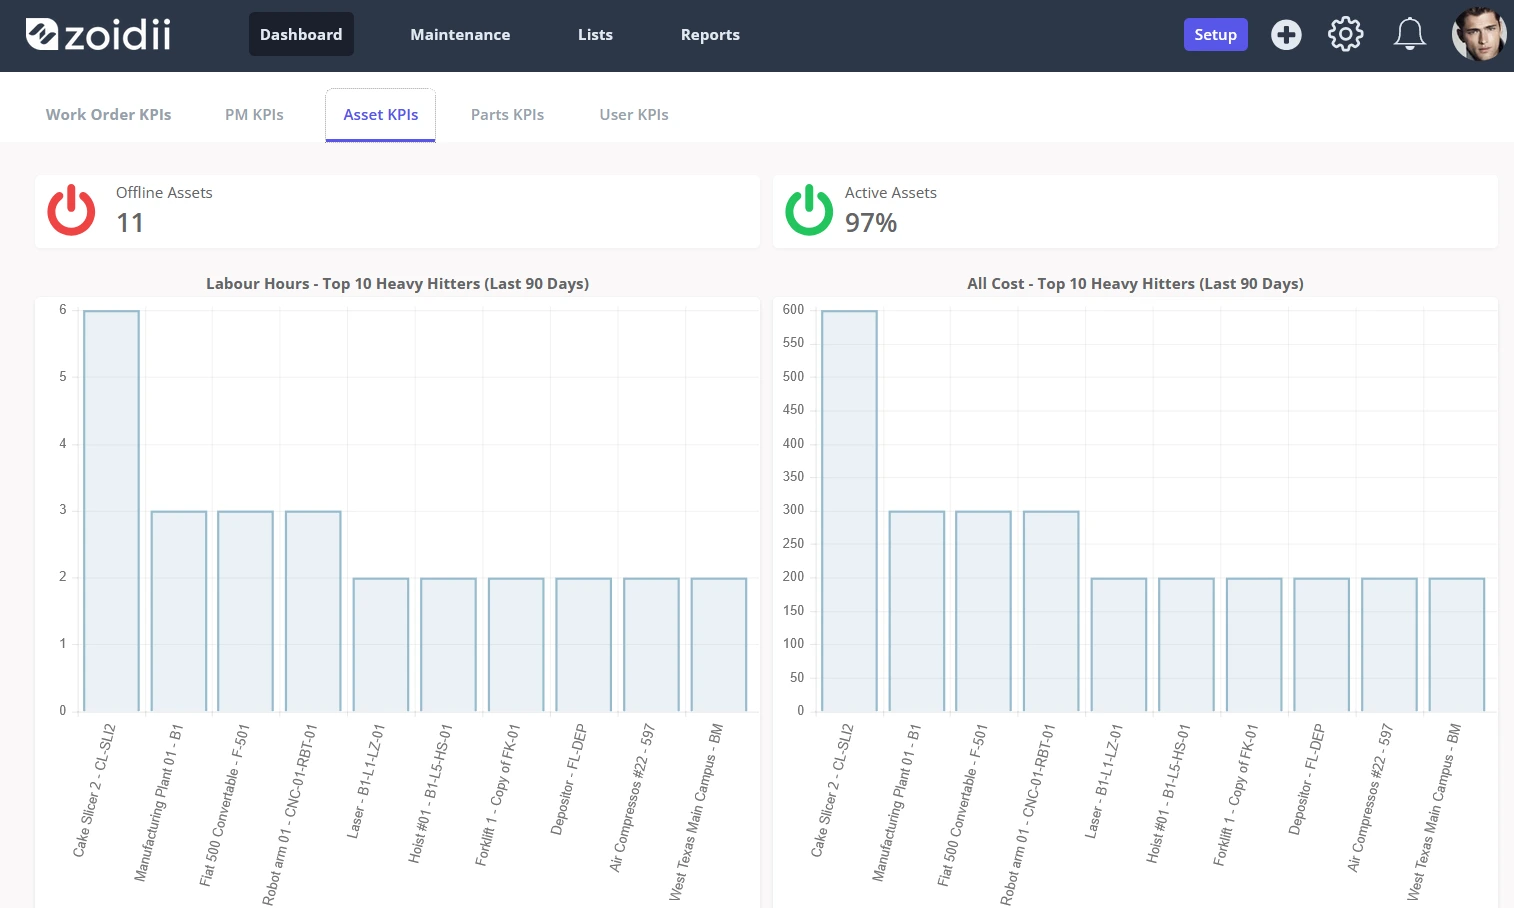
5. Planned vs. Reactive Maintenance Ratio
This ratio is the percentage of your total maintenance work that's planned (preventive, predictive, or scheduled corrective) versus reactive (break-fix). World-class maintenance operations target an 80/20 split: 80% planned, 20% reactive.
Most facilities that haven't implemented a CMMS sit closer to 50/50 or even 40/60. That imbalance is expensive. Reactive maintenance costs 3-5x more per task than planned work because of emergency labor rates, expedited parts shipping, and cascading failures.
What a CMMS does here
The system categorizes every work order by type. Monthly reports show your exact ratio, and you can track the trend over time. Facilities that implement a CMMS and commit to the PM program typically shift from 55% reactive to under 30% reactive within 12-18 months.6. Mean Time To Repair (MTTR)
MTTR measures the average time it takes to repair an asset and return it to full operational status after a failure. MTTR includes the time spent on diagnosis, actual repair, testing, and getting the asset back online. A low MTTR indicates efficient maintenance processes and skilled technicians.
This KPI is crucial for understanding the efficiency of your maintenance operations and the impact of failures on productivity or service levels. A high MTTR means longer downtime, which can lead to significant operational disruptions, lost revenue, or reduced occupant satisfaction. It helps identify bottlenecks in the repair workflow, areas where technician training might be needed, or issues with parts availability.
What a CMMS does here
By logging the start and end times of every repair work order against each asset, the system automatically calculates MTTR. It can also segment MTTR data by technician, asset type, or location, providing granular insights into where repairs are most efficient or where improvements are needed. Trend lines can show whether repair times are improving or worsening over time.KPI Comparison Table: Manual Tracking vs. CMMS

FAQs
What PMC percentage should I target first?
Start with 80% and work toward 90%. If you're currently below 70%, focus on getting the scheduling infrastructure right before worrying about hitting a specific number.How long does it take to see ROI from a CMMS?
Most facilities see measurable results within 3-6 months. The biggest early wins come from reduced reactive maintenance and better parts inventory management. Full ROI, including extended asset life, typically materializes within 12-18 months.Can a small facility (under 50,000 sq. ft.) justify a CMMS?
Yes. Modern cloud-based CMMS platforms start under $50/month. If you're managing even 20-30 assets with any PM schedule, the time savings alone cover the cost. The data you gain for budget justification is a bonus.Which KPI should I track first?
PM compliance. It's the foundation. If you're not completing scheduled maintenance on time, every other metric will suffer. Get PMC above 80%, then layer in the remaining KPIs.How do I get buy-in from leadership for CMMS adoption?
Speak their language: money. Calculate your current reactive maintenance costs, show the industry benchmarks for planned vs. reactive savings (3-5x cost difference), and present a 12-month projection. Hard numbers win budget approvals.Do I need IoT sensors to track these KPIs effectively?
No. IoT integration is helpful for real-time downtime tracking and condition-based maintenance, but a CMMS tracks all six KPIs above through manual work order data alone. Sensors are a nice-to-have, not a requirement.How often should I review facility KPIs?
Weekly for work order resolution time and PM compliance. Monthly for downtime, cost per asset, and maintenance ratios. Quarterly for MTTR trends and heavy-hitter analysis.Making the Data Work For You
Tracking KPIs without acting on them is just administrative overhead. The facility managers who get the most value from their CMMS are the ones who build a 15-minute weekly review into their routine: check PM compliance, scan for overdue work orders, glance at the heavy-hitter list. That habit, more than any software feature, is what separates facilities that run well from ones that run on adrenaline and emergency purchase orders. The best facility management KPIs tracked through a CMMS aren't just numbers on a dashboard. They're the early warning system that keeps your buildings running, your budgets intact, and your weekends free from emergency calls.