
Unplanned downtime now costs U.S. manufacturers an estimated $50 billion annually. The average facility loses $260,000 for every hour a critical line sits idle, and for automotive plants, that figure tops $2.3 million per hour. Each hour of unplanned downtime costs roughly 50% more today than it did in 2019.
Every one of those numbers traces back to the same three performance dimensions: Reliability, Availability and Maintainability, collectively known as RAM. Understanding how these three metrics interact, and putting systems in place to measure and improve them, is the difference between a maintenance program that prevents downtime and one that perpetually chases it. This guide breaks down exactly what RAM means for maintenance teams in 2026, how each metric is calculated, and how a modern Computerized Maintenance Management System (CMMS) turns RAM from a theoretical framework into a daily operational advantage.
Key Takeaways:
1. RAM metrics are interdependent — sets up the core tension the article explores
2. Downtime is getting more expensive — anchors urgency with the 2026 cost stats
3. Most downtime is a data problem — bridges the gap between the symptom and the CMMS solution
4. Parts availability is the hidden MTTR killer — surfaces the 47% stat as a concrete, actionable insight
5. World class is achievable — closes on an optimistic, conversion friendly note with benchmark targets
What Is RAM in Maintenance Management?
RAM stands for Reliability, Availability and Maintainability. These are three interdependent engineering attributes that together determine how well an asset performs its function over time. Originally developed in systems engineering for aerospace and defense applications, RAM analysis is now widely applied across manufacturing, oil and gas, power generation, mining and facilities management.
The three parameters are deeply connected. Improving one will often affect the others, sometimes in conflicting ways. That is why RAM analysis treats them as a system rather than three separate targets, and why a CMMS is the most effective tool for tracking and improving all three simultaneously.
Reliability: How Long Does Equipment Run Before It Fails?
Reliability is the probability that an asset will perform its intended function without failure under specified conditions over a defined period. In practical terms, it answers a simple question: how long can we count on this machine to keep running?
How Reliability Is Measured
The primary metric for equipment reliability is Mean Time Between Failures (MTBF), which represents the average operating time between unplanned breakdowns.
MTBF = Total Operating Time divided by Number of Failures
A higher MTBF means fewer failures, more predictable production and less emergency maintenance spend. A declining MTBF signals an asset approaching the end of life, a maintenance gap or a root cause that has not yet been addressed.
For equipment still in the design phase, reliability can be predicted using Failure Mode and Effects Analysis (FMEA) and Fault Tree Analysis (FTA), which map out the most likely failure modes before they occur in production.
Why Reliability Matters in 2026
The data on reactive maintenance is stark. Research shows that 67% of manufacturers still rely primarily on reactive maintenance, and 79% of teams saw unplanned downtime stay the same or worsen over the past year. Equipment failure alone accounts for 42% of all unplanned downtime in manufacturing, making reliability improvement the single highest leverage target for reducing production losses.
Unreliable equipment does not just cause downtime. It creates safety hazards, degrades product quality, triggers emergency parts purchases at 30% to 40% premium over standard pricing and generates expedited labor costs when teams scramble to recover lost production at overtime rates.
How CMMS Software Improves Reliability
A CMMS improves reliability primarily by making preventive maintenance consistent and measurable.
Automated PM scheduling. The CMMS schedules recurring maintenance tasks based on calendar intervals, operating hours, production cycles or condition triggers. When an asset approaches its MTBF threshold, the system automatically generates a preventive maintenance work order, stopping the failure before it happens rather than responding after it occurs.
Failure history and trend tracking. Every work order closed in a CMMS records the failure date, time, reported symptoms, failure codes, parts used and repair time. Over time, this data builds a complete failure history per asset, enabling teams to spot deteriorating reliability trends before they become costly breakdowns.
Root cause analysis. When the same equipment fails repeatedly, CMMS reporting surfaces the pattern. Pareto analysis of failure data can reveal that a small number of assets, often around 20% of the fleet, are responsible for the majority of downtime. This allows maintenance resources to be concentrated where they have the most impact.
FMEA integration. Maintenance teams can link FMEA findings directly to preventive maintenance tasks in the CMMS, ensuring that known failure modes are being actively prevented with documented inspection and servicing procedures.
Maintainability: How Quickly Can Equipment Be Restored After a Failure?
Maintainability describes how easy, fast and resource-efficient it is to restore an asset to its intended operating state after a failure. Where reliability is about preventing downtime, maintainability is about minimizing it when it does occur.
It is measured using Mean Time to Repair (MTTR), which represents the average time from failure detection to full restoration of service.
MTTR = Total Repair Time divided by Number of Repair Events
A lower MTTR means your team recovers faster from every failure. The impact compounds quickly. A facility that cuts MTTR from 8 hours to 4 hours doubles its effective recovery speed for every failure event, freeing up labor and reducing lost production time.
2026 MTTR Benchmarks
Industry benchmarks for MTTR in 2026 show a clear performance gap between reactive and proactive maintenance operations.
- World-class MTTR: Under 2 hours
- Good performance: 2 to 4 hours
- Needs improvement: Over 6 hours
- Industry average in manufacturing: Around 5 hours
- CMMS impact: Plants using CMMS platforms typically reduce MTTR by 20% to 30% through better coordination, faster parts access and diagnostic clarity
The Four Components of MTTR
Repair time is not a single activity. It breaks into four distinct phases, each of which a CMMS addresses in a different way.
1. Detection time is how long it takes between a failure occurring and someone noticing it. Condition monitoring integrations and IoT sensor alerts in a CMMS reduce this to near zero by triggering automatic work orders the moment anomalous readings are detected.
2. Diagnostic time is how long it takes to identify the root cause. CMMS access to full failure histories, standard operating procedures (SOPs) and equipment-specific troubleshooting guides on mobile devices dramatically cuts diagnostic time for technicians in the field.
3. Parts and tools retrieval time is how long it takes to source the required materials. Integrated spare parts inventory in a CMMS, with low stock alerts and automated reorder triggers, ensures critical spares are available when needed rather than ordered after the failure occurs.
4. Active repair time is the actual fix. Detailed step-by-step repair procedures stored in the CMMS and accessible via mobile devices at the point of work reduce active repair time by ensuring technicians arrive prepared with the right procedure, parts and safety requirements in hand.
How CMMS Software Improves Maintainability
Digital SOPs linked to assets. Store detailed repair procedures, diagrams, torque specifications and safety warnings directly within asset records in your CMMS. When a failure occurs, and a work order is generated, the relevant procedures surface automatically, eliminating time wasted searching for documentation.
Spare parts inventory management. A CMMS tracks parts inventory in real time, links parts consumption to specific work orders and generates low stock alerts before shortages occur. Having spare parts available directly attacks the 47% of MTTR that is parts-related rather than repair-related.
Work order planning and scheduling. Proper job planning ensures parts, tools, procedures and safety requirements are organized before work begins. Job planning is documented to reduce active repair time significantly. A CMMS standardizes this planning process across every work order, every technician and every shift.
Mobile access at the point of work. Technicians access work orders, asset history, LOTO procedures and parts lists directly on mobile devices in the field, eliminating trips back to the office for information and reducing diagnostic and setup time on every job.
Availability: The Outcome of Reliability and Maintainability
Availability is the percentage of scheduled operating time during which an asset is operational and capable of performing its function. It is the metric that directly translates RAM performance into production capacity and revenue impact. Availability combines both reliability and maintainability into a single number. It is calculated using MTBF and MTTR together.
Availability = MTBF divided by (MTBF + MTTR) This formula makes the relationship between the three RAM components concrete. Consider what a difference strong performance in both reliability and maintainability makes in practice.
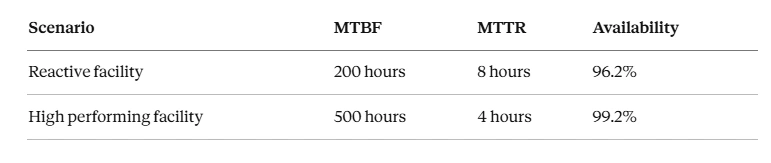
That 3% availability gap represents 263 additional hours of uptime per year in an 8,760-hour operation. For a facility with $100,000 per hour downtime costs, that translates to over $26 million in annual value from metric-driven improvement.
2026 Availability Benchmarks
- Best in class: Less than 5% unplanned downtime
- Acceptable: 5% to 10% unplanned downtime
- Critical: Above 15% unplanned downtime
- Predictive maintenance programs: Associated with 5.42% unplanned downtime on average
- Most plants today: Operate at an Overall Equipment Effectiveness (OEE) of around 60%, versus a world-class target of 85% or higher

How RAM Metrics Work Together
The key insight in RAM analysis is that the three parameters are interdependent and often in conflict. You cannot optimize each one in isolation.
Increasing reliability through more frequent preventive maintenance can reduce availability if PMs are poorly planned and consume excessive scheduled production time. Improving maintainability through modular equipment design or better parts stocking increases costs that must be weighed against MTTR reduction benefits. Aggressively reducing MTTR by keeping technicians on standby improves responsiveness but increases labor costs that may outweigh the availability gains.
This is precisely why RAM analysis requires a data-driven, integrated approach and why a CMMS is the most practical tool for managing it. The CMMS does not just track individual metrics. It provides a unified data environment that lets maintenance and engineering teams see how changes in one parameter ripple through the others.
The RAM Data Feedback Loop
The most effective RAM improvement programs operate as a continuous feedback loop.
Measure. The CMMS captures MTBF, MTTR, downtime events and repair details automatically from every closed work order. Analyze. Reporting tools surface failure patterns, high MTTR assets and PM compliance gaps. Improve. Maintenance strategies are adjusted: PM intervals optimized, spare parts inventory recalibrated, SOPs updated. Validate. Updated MTBF and MTTR data confirm whether changes are delivering results. Repeat. The loop continues, progressively improving reliability and availability over time. When actual performance deviates from targets, that deviation is an immediate signal. Either the maintenance program execution has a gap, or the asset is experiencing conditions outside its design parameters. Both are actionable findings, but only if the data is being captured consistently.
CMMS as the Engine of RAM Improvement
Understanding RAM is valuable. Measuring it consistently and acting on the data is what produces results. A CMMS provides the infrastructure that makes this possible at scale, across every asset in a facility.
Here is how specific CMMS capabilities map to each RAM dimension.
For Reliability (Increasing MTBF)
Automated preventive maintenance scheduling based on operating hours, calendar intervals or IoT-triggered condition monitoring alerts keeps assets serviced before they fail. PM compliance tracking gives managers visibility into whether scheduled tasks are being completed on time. World-class operations target 90% or higher PM on time completion. Failure code standardization across technicians enables meaningful statistical analysis of failure patterns over time. Asset hierarchies link component failures to parent equipment, identifying systemic issues in connected systems before they cascade into larger failures.
For Maintainability (Reducing MTTR)
Digital SOPs and repair procedures are linked to assets and accessible on mobile devices at the point of work, eliminating the time technicians spend searching for instructions. Spare parts inventory management with consumption tracking, low stock alerts and automated reorder triggers ensures parts are available when a failure occurs rather than after. Structured work order planning confirms that parts, tools, safety procedures and technician assignments are in place before work begins. Technician skills tracking enables assignment of work orders to qualified personnel based on certifications and specializations, eliminating rework and diagnostic delays.
For Availability (Maximizing Uptime)
Real-time downtime logging captures downtime start and stop times with reason codes through work orders, enabling accurate availability calculation by asset and production line. Live KPI dashboards show MTBF, MTTR, availability and OEE in real time rather than in a weekly spreadsheet report. The planned versus unplanned maintenance ratio reveals whether your program is proactive or reactive. Best-in-class organizations achieve less than 10% unplanned maintenance. Predictive maintenance integration allows condition monitoring alerts from IoT sensors to trigger CMMS work orders automatically, enabling intervention before failure occurs.
RAM in Practice: A Real World Example
Consider a manufacturing facility where a Pareto analysis of CMMS failure data reveals that 12 assets are causing 65% of all downtime. Targeted preventive maintenance programs are designed for those 12 assets, with condition-based monitoring on the top 5.
The result: the planned to unplanned maintenance ratio shifts from 33:67 to 78:22. MTTR improves from 4.2 hours to 2.1 hours. OEE increases from 58% to 72%. The annual impact is $1.2 million in recovered production capacity.
This outcome is not unusual. It is what systematic RAM analysis, powered by CMMS data, consistently delivers when teams stop managing by gut feel and start managing by metrics.
Getting Started: Building a RAM Driven Maintenance Program with CMMS
For maintenance teams looking to put RAM principles into practice, the starting point is always data. Without accurate MTBF and MTTR measurements, improvement is guesswork. Step 1: Asset registration. Enter all maintainable assets into the CMMS with specifications, failure modes, maintenance requirements and spare parts links. The asset registry is the foundation for all subsequent RAM tracking.
Step 2: Establish baseline metrics. Begin capturing failure events and repair times consistently through standardized work orders. Within 60 to 90 days, you will have enough data to calculate baseline MTBF and MTTR per asset.
Step 3: Set up preventive maintenance schedules. Use initial failure data plus manufacturer recommendations or historical records to define PM intervals. Automate scheduling in the CMMS so that tasks are generated and assigned without manual triggers.
Step 4: Build spare parts inventory. Based on failure history and lead times, stock critical spares for high MTBF impact components. Link parts to work orders in the CMMS to track consumption and trigger reorders automatically. Step 5: Review and optimize. Monthly CMMS reports on MTBF trends, MTTR by asset, PM compliance rates and downtime costs provide the data for continuous improvement. Adjust PM intervals, update SOPs and reallocate resources based on what the data shows rather than what it felt like last quarter.
Frequently Asked Questions
What is RAM in maintenance management? RAM stands for Reliability, Availability and Maintainability. These are three interdependent metrics that define how well an asset performs over time. Reliability (measured by MTBF) describes how long equipment runs before failing. Maintainability (measured by MTTR) describes how quickly it can be restored after a failure. Availability combines both into the percentage of time the asset is operational and ready for use.
What is a good MTBF for manufacturing equipment? MTBF targets vary significantly by equipment type and industry, but the key indicator is a consistently increasing trend. The goal is continuous improvement from your baseline. The most reliable way to track MTBF over time is through CMMS failure history data, which provides the foundation for setting realistic, evidence based improvement targets.
What is a good MTTR benchmark in 2026? World class MTTR is under 2 hours. Good performance falls between 2 and 4 hours, and anything over 6 hours signals significant improvement opportunities. The manufacturing industry average is around 5 hours. Plants using CMMS software typically reduce MTTR by 20% to 30% through better parts availability, faster technician access to procedures and improved job planning.
How does CMMS software improve equipment availability? A CMMS improves availability by attacking both sides of the availability equation. It increases MTBF through automated preventive maintenance scheduling and failure pattern analysis. It reduces MTTR through better job planning, spare parts management, mobile access to SOPs and real time work order coordination. Together, these improvements directly raise the percentage of time each asset is operational and ready for production.
What is the difference between planned and unplanned downtime in RAM analysis? Planned downtime refers to scheduled maintenance stops such as preventive maintenance, inspections or upgrades. While planned downtime reduces availability in the short term, it increases reliability and reduces unplanned downtime over time. Unplanned downtime is a failure event that interrupts production unexpectedly. Best in class facilities keep unplanned downtime below 5% of total operating time and achieve planned to unplanned maintenance ratios of 90:10 or better.
What does OEE have to do with RAM? Overall Equipment Effectiveness (OEE) measures the percentage of scheduled production time that is truly productive. Its availability component is directly tied to RAM performance, specifically to MTBF and MTTR. World class OEE is 85% or higher. The average manufacturing plant runs at around 60%. Every percentage point of OEE recovered through better RAM performance represents significant additional revenue. A CMMS that automatically tracks and displays OEE alongside MTBF and MTTR gives maintenance teams a complete, real time picture of asset performance.