
Your Computerized Maintenance Management System (CMMS) collects information every single day. Each closed work order, part used, and asset failure contributes to a broader understanding of your entire maintenance operation.
Putting these details together lets you stop reacting to problems and start predicting them. Turning this raw CMMS data into a smart maintenance strategy is how you get ahead instead of just keeping up. A data-driven approach helps you cut downtime, improve efficiency, and make confident decisions that benefit your bottom line. It’s about turning information into action and replacing guesswork with a solid plan.
Moving Beyond Guesswork in Maintenance Planning
Relying on gut feel and fragmented records leads to surprise breakdowns and wasted resources. You need clear data to stay ahead of failures.
Why guesswork hurts you:
- Lost insights - Relying on memory means minor faults often go unnoticed. You only notice problems once they’ve grown into full-blown breakdowns.
- Costly emergencies - Every surprise failure triggers overtime pay, rush-shipped parts, and frantic repairs. Those emergency expenses can easily double your maintenance budget.
- Blind spots - Without one source of truth, repeat failures hide in plain sight. You miss patterns across shifts or sites, and end up fixing symptoms instead of root causes.
Essential CMMS Metrics for Strategic Improvement
The right metrics give you a clear view of your operational health. A good CMMS doesn't just store data; it presents information in a way that helps you see what's happening.
These insights point you to the exact areas that need attention, letting you focus your improvement efforts where they’ll have the greatest impact.
Asset Failure Analysis
- Identifies your most failure-prone machines so you can target improvement efforts.
- Track failure codes, mean repair time, and cost per event to rank assets by risk and decide whether to retrain operators or replace equipment.
Work Order Completion Rate
- Measures the percentage of work orders closed by their due date.
- Spot backlog trends by technician or department, then rebalance assignments or add support before small delays turn into major holdups.
Preventive Maintenance (PM) Compliance
- Calculates on-time completion of scheduled PM tasks.
- Monitor compliance weekly or monthly; a drop often predicts spikes in emergency repairs, so you can adjust schedules or reassign resources to stay ahead.
Maintenance Cost Ratio
- Compares total maintenance spend (labor, parts, outside services) against asset value or production output.
- Use this ratio to benchmark performance, justify budget shifts, and pinpoint areas where expenses exceed returns.
Mean Time to Repair (MTTR)
- Tracks the average time from work order creation to completion.
- Drill into the longest repair jobs to streamline procedures or provide targeted training; faster fixes mean less downtime.
Inventory Spend and Turnover
- Shows where your parts budget goes and how quickly stock moves through the system.
- Analyze spend by part category, set reorder thresholds, and avoid both stockouts and carrying-cost waste.
A 4-Step Process for Data-Driven Maintenance
Having the data is one thing - using it to drive change requires a clear process.
This simple framework provides a structured approach to utilising your CMMS data, refining your maintenance strategy from the ground up. It creates an improvement cycle that builds on itself over time.
1. Set Your Baseline
- Standardize data entry - Define exactly how technicians log work orders, parts used, and failure reasons in your CMMS.
- Collect reliable data - Run this process for at least three months to capture typical failure rates, repair times, and PM compliance.
- Establish benchmarks - Calculate your current metrics: downtime per asset, mean time to repair (MTTR), and percentage of on-time PMs to serve as your reference point.
2. Spot Failure Patterns
- Filter and sort - Use your CMMS to group failures by asset type, failure code, shift, or operator.
- Identify top offenders - Pinpoint the three machines or components that account for the most downtime or highest repair costs.
- Analyze root causes - Drill into each frequent failure, operator errors, worn parts, seasonal conditions, and rank them by impact on production.
3. Tune Your PMs
- Align schedules to risk - If Equipment X fails every 800 operating hours, set its PM at 750 hours to catch issues early.
- Leverage nested PMs - Bundle related tasks: daily checks, weekly lubrication, quarterly inspections into a single work order to save technician travel time.
- Automate alerts - Update your CMMS so techs receive push notifications or email reminders for adjusted PM dates, ensuring nothing slips through.
4. Measure & Refine
- Review key metrics - On a monthly cadence, compare your current downtime, MTTR, and PM compliance against your established benchmarks.
- Hold quick retrospectives - Gather your maintenance leads for a 15-minute review, celebrate wins, discuss roadblocks, and decide on next tweaks.
- Adjust and repeat - Implement lessons learned, reset your targets if needed, and run the cycle again next quarter, each iteration driving further gains.
How Zoidii Simplifies Your Maintenance Data
We know that maintenance teams are busy. That’s why we built Zoidii to make data collection and analysis straightforward, even for teams new to CMMS technology. Our platform gives you powerful insights without the complexity.
Intuitive Mobile Data Capture
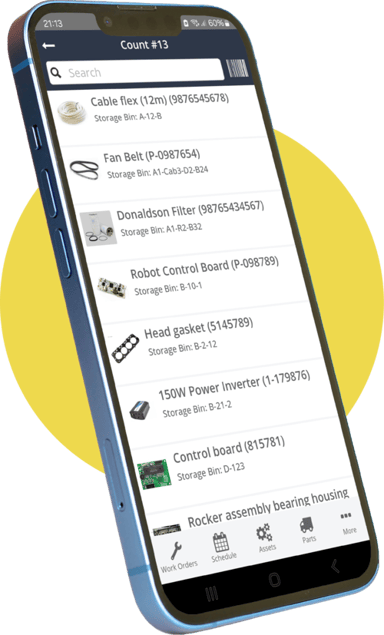
Accurate data starts at the source. With the Zoidii mobile app, your technicians can capture information directly from the plant floor.
They can update work orders, log parts used, and upload photos of failures right from their phones.
This eliminates the need for paper forms and ensures that details are captured accurately in the moment, not forgotten by the end of the day.
Pre-Built Reporting Dashboards
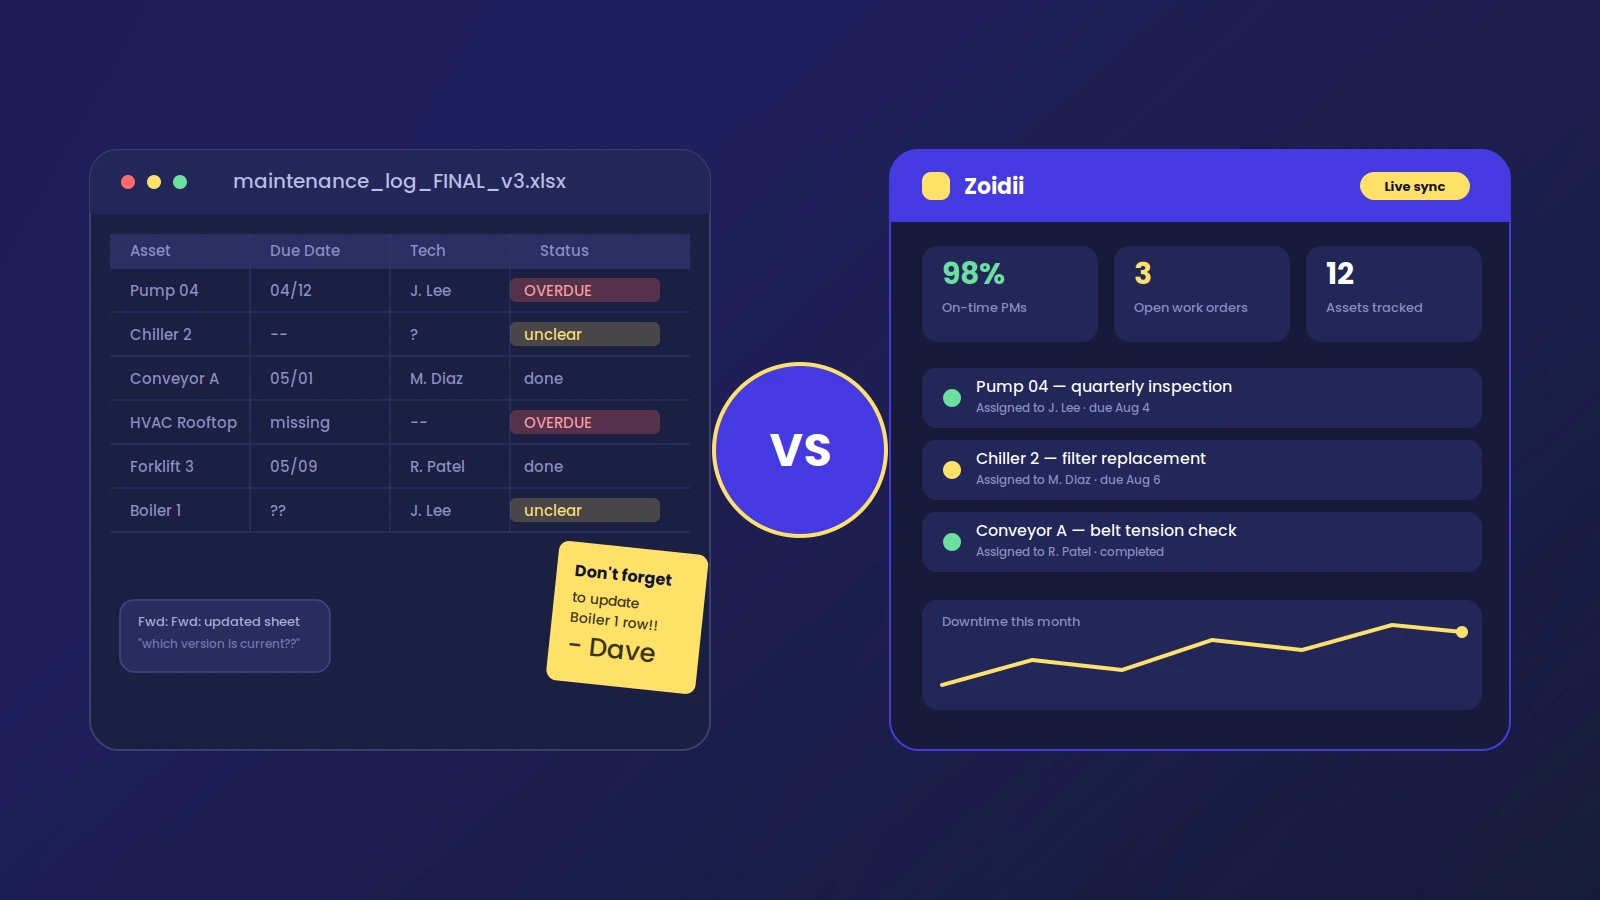
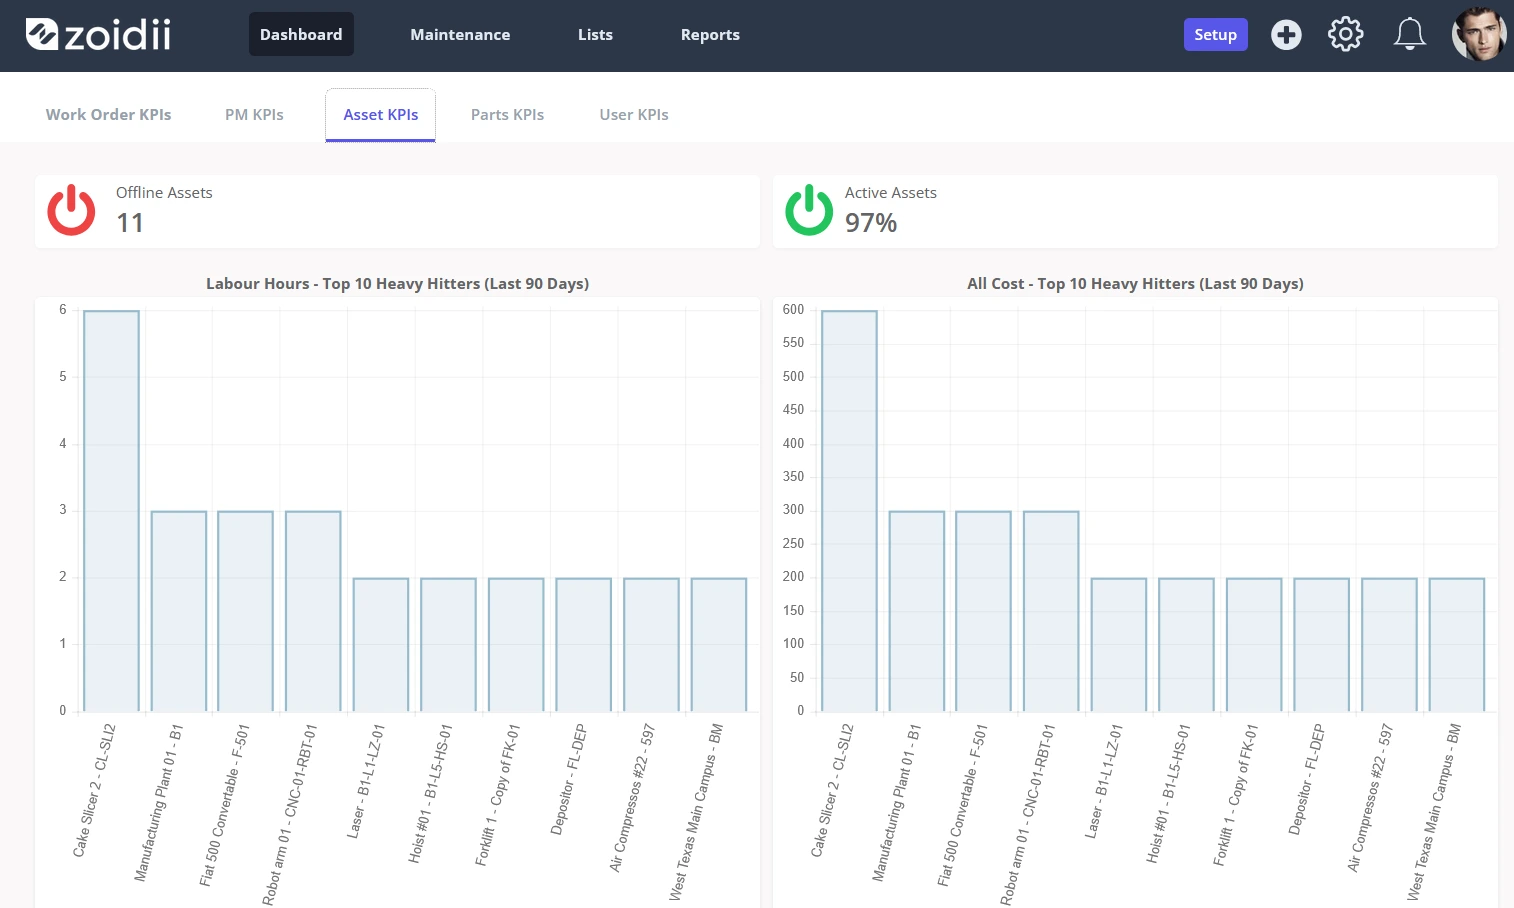
You shouldn't need a degree in data science to see your maintenance performance. Zoidii comes with pre-built dashboards that turn your raw data into simple, visual reports.
With a few clicks, you can see your top maintenance costs, work order trends, and PM compliance rates. These reports make it easy to spot trends, share progress with management, and make informed decisions quickly.
Clear ROI Calculation
Every maintenance decision connects back to the bottom line. Zoidii helps you demonstrate the financial impact of your work. Tracking reductions in downtime, labor hours, and parts spending allows you to clearly show the return on your investment in better maintenance practices. Our online ROI Calculator can estimate your potential savings before you get started.
Data Can Transform Your Operations
Switching to a data-driven maintenance strategy might seem like a big step, but the results speak for themselves. With the right tools, you can reduce frustrating breakdowns, streamline your team’s workflow, and take control of your maintenance budget. It all starts with using the information you already have.
Book a Tour with Our Team
Find out how simple it can be to turn your maintenance data into your greatest asset. Let us show you how Zoidii works.
Book a tour with our team for a personalized look at how our platform can help you build a smarter maintenance strategy.