
Every day that a manufacturing or facilities-dependent business operates without a Computerized Maintenance Management System (CMMS), it is silently hemorrhaging revenue across a dozen fronts simultaneously.
Unplanned equipment failures, emergency parts shipments at premium prices, degraded product quality, missed delivery commitments, labor inefficiency, regulatory penalties, and shortened asset life all combine into a compounding financial drain that is rarely visible on a single line of a balance sheet — but is devastatingly real.
This article presents a research-backed examination of the full spectrum of revenue losses associated with the absence of a CMMS, the financial mechanisms through which those losses occur, and the specific, quantifiable ways that modern CMMS software prevents them.
The evidence is unambiguous: in asset-intensive industries, a CMMS is not a cost center — it is a revenue protection platform with a documented return of 300–600% within the first 18–36 months of deployment.
- $1.4 Trillion - Lost annually to unplanned downtime by the world’s 500 largest companies — equivalent to 11% of total revenues (Siemens True Cost of Downtime Report, 2024).
- $200,000/hr - Average cost of a single hour of unplanned downtime across all manufacturing sectors (Aberdeen Research).
- 300-600% - Typical ROI achieved by facilities within 18–36 months of full CMMS deployment (industry benchmark, multiple sources).
Section 1: The Hidden Revenue Drain — What No CMMS Really Costs You
Most finance leaders are acutely aware of the direct costs of maintenance: labor hours, replacement parts, contractor fees. What they routinely underestimate — or miss entirely — are the indirect and systemic revenue losses that flow from reactive, undermanaged maintenance operations.
Research consistently shows that indirect costs dwarf direct ones, yet they go untracked in organizations that lack a CMMS.
1.1 The Scale of the Problem
The Siemens True Cost of Downtime 2024 report, one of the most comprehensive studies of its kind, found that unscheduled downtime costs the world’s 500 biggest companies $1.4 trillion annually — an increase of 62% from $864 billion in 2019–2020.This escalation has outpaced inflation dramatically, driven by higher-capacity supply chains with less slack, rising energy prices, increased labor costs, and the compounding value of goods never produced during an outage.
For individual manufacturing facilities, the numbers are equally alarming. The average large plant now loses $129 million annually to downtime alone — a 65% increase from 2019 levels.
Two-thirds of companies experience unplanned downtime at least once a month, and the average cost per hour is $125,000, according to an ABB survey of more than 3,200 global plant maintenance leaders.
- 800 hrs/yr - Average hours of unplanned machine downtime faced by a typical manufacturer — more than 15 hours of paid non-productive time every single week.
- 25 incidents/month - Average number of downtime incidents per manufacturing facility per month (Siemens, 2024).
- 42% - Proportion of unplanned downtime attributable to equipment failure — the single largest preventable cause.
1.2 Industry-by-Industry Downtime Costs
The financial impact of downtime is not uniform. Certain industries bear an outsized burden due to the capital intensity of their operations, the complexity of their supply chains, and the contractual obligations that govern their delivery timelines: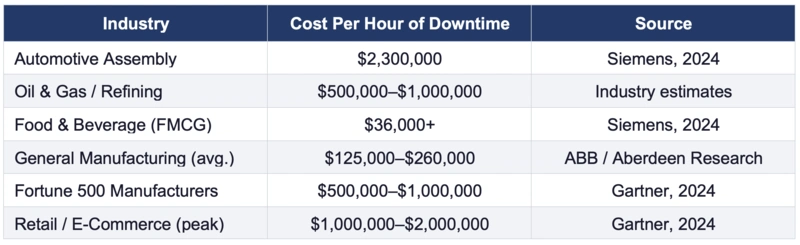
In automotive manufacturing alone, downtime runs approximately $38,000 per minute. For context, the average unplanned downtime incident lasts four hours.
That is a potential $9.2 million loss from a single equipment failure that a functioning CMMS might have prevented through routine preventive maintenance.
1.3 The Reactive Maintenance Trap
Businesses without a CMMS overwhelmingly default to reactive maintenance — also called “run to failure” or “breakdown maintenance.”On the surface, this model appears economical: there are no upfront scheduling costs, no dedicated maintenance software subscriptions, no overhead for planning. In practice, it is the most expensive maintenance strategy that exists.
Research by the U.S. Department of Energy found that reactive maintenance costs 3 to 5 times more than a comparable job performed on a planned basis.
Every emergency repair triggers a cascade of premium costs: overtime labor at 1.5x to 2x standard rates, expedited parts shipping that can increase per-part costs by 20–40%, extended diagnostic downtime while technicians identify an unfamiliar fault, secondary damage to adjacent components that were not the original failure target, and the cascading ripple effect on production schedules downstream.
Industry Finding
Studies consistently show that unplanned repairs cost 3 to 5 times more than the same job performed on a planned basis. A part that costs $50 to ship normally may cost $500 or more to ship overnight when an asset is down and production is stopped. (Tractian / Maintenance Cost Analysis)
Unplanned downtime also accounts for approximately 80% of total production stoppages in manufacturing, and costs 3 to 5 times more per incident than planned maintenance. This is the reactive maintenance trap: you pay far more, produce far less, and have no systematic way to prevent the next failure.
Section 2: Six Ways the Absence of a CMMS Destroys Revenue
2.1 Emergency Parts Shipments: The Parts Premium Problem
When equipment fails unexpectedly, the maintenance team faces a parts procurement crisis. The required component may not be in inventory. Lead times for standard shipping — often several days or weeks for industrial components — are unacceptable when a production line is down.The result is emergency procurement: overnight shipping, premium distributor pricing, or expedited freight at rates that dwarf standard logistics costs.
A part that carries a standard shipping cost of $50 may cost $500 or more to procure overnight. For large components — motors, gearboxes, hydraulic assemblies — emergency freight charges can run into the thousands. Multiply this by 25 downtime incidents per month, per facility, and the procurement premium alone becomes a significant and entirely avoidable budget line.
- Parts Premium: Emergency procurement drives parts costs 20–40% higher than planned purchasing
- Freight Costs: Overnight freight for industrial components can cost 10x standard shipping rates
- Lifecycle Costs: Reactive maintenance programs spend 3–5x more on parts over an asset’s lifecycle than preventive programs
- Inventory Waste: Lack of inventory visibility leads to both costly stockouts and expensive overstock — capital tied up in unnecessary spare parts inventory
This leads to a dual failure: stockouts of critical components (causing extended downtime) and overstock of rarely-used parts (tying up capital and warehouse space).
2.2 Downtime Delays: The Revenue You Never Make Back
Lost production time is permanently irrecoverable. When a line goes down for four hours, you cannot simply run it for four extra hours the following day to compensate — at least not without incurring overtime labor costs, reduced margins on the catch-up production, and potential conflicts with the planned maintenance schedule.- $50 Billion - Annual cost of unplanned downtime to U.S. industrial manufacturers, encompassing lost production, idle labor, scrapped materials, and direct repair costs.
Industry analysts estimate that almost every factory loses at least 5% of productivity to downtime, with some experiencing losses as high as 20%. For a facility generating $20 million in annual revenue, a 10% downtime-related productivity loss represents $2 million in revenue that was never earned — and never can be.
The Hidden Cost Multiplier
When calculating downtime cost, most organizations capture only lost production value. The true cost also includes: idle labor still receiving wages, scrap and wasted materials, overtime to make up lost production, penalties for missed deliveries, and emergency repair costs. Organizations that rely only on obvious line items undercount their downtime exposure by an estimated 25–40%.
2.3 Lower Product Quality: The Maintenance-Defect Connection
Equipment that is not properly maintained does not fail all at once. Long before an outage occurs, degraded machinery produces degraded output. Worn bearings create vibration. Miscalibrated instruments allow dimensional drift. Dirty heat exchangers fail to reach required temperatures.Degraded seals allow contamination. These quality failures can persist for weeks or months before they cause a visible breakdown — but they silently corrupt product quality throughout the entire period.
The financial consequences of poor product quality are severe and compound in multiple directions simultaneously:
- Internal Scrap: Increased scrap rates: materials that fail quality inspection must be discarded, wasting raw material and production labor
- Rework: Rework costs: defective units must be processed a second time, doubling the labor and machine time for those units
- Returns: Customer returns and warranty claims: defective products that reach customers generate return processing, replacement, and service costs
- Recalls: Recall costs: in severe cases, product recalls require product retrieval, regulatory response, legal fees, and public relations management
- 41% - Proportion of food product recalls linked to equipment failures that could have been prevented through proactive maintenance management (Oxmaint / FDA, 2025).
- $10M - $50M - Average total financial impact of a food product recall — $10M in direct costs, up to $50M when brand damage, retailer delisting, and litigation are included.
Beyond recalls, the Cost of Poor Quality (COPQ) — which encompasses scrap, rework, warranty claims, returns, and complaint resolution — is a pervasive and frequently underestimated drain.
COPQ is widely acknowledged to represent between 5% and 30% of total sales revenue for manufacturers with poor quality control programs. For a company generating $50 million in annual revenue, this could represent $2.5 million to $15 million in annual quality-related losses.
2.4 Missed Delivery Deadlines: The Contractual and Reputational Cost
In modern manufacturing and supply chain environments, delivery commitments are often contractually binding. Late deliveries trigger penalty clauses, chargebacks from retail partners, and in some cases, breach-of-contract litigation.But even where no explicit financial penalty exists, a pattern of missed delivery commitments erodes customer confidence, damages long-term relationships, and ultimately costs future business.
Equipment downtime and quality failures are the primary operational causes of missed delivery deadlines. When a production line goes down unexpectedly, the entire downstream production schedule is disrupted.
Orders that were on track to ship on time fall behind. Expedited production attempts — running overtime, skipping changeovers, pushing machines harder — create new quality risks and further equipment strain. The cycle compounds. 60%
- 60% - Proportion of manufacturing companies reporting weekly delays in material deliveries — most commonly caused by equipment failures disrupting production schedules.
The reputational dimension is harder to quantify but no less real. Surveys consistently show that customers who experience a significant service failure — including repeated late deliveries — are significantly more likely to switch suppliers at their next procurement cycle.
In competitive markets, every missed deadline is a risk to future revenue that extends far beyond the immediate order.
2.5 Labor Inefficiency and Overtime Costs
Reactive maintenance organizations are fundamentally inefficient at deploying their maintenance workforce. Without a CMMS, work orders are managed through informal communication channels: phone calls, paper forms, whiteboards.Technicians lack digital access to equipment history, parts availability, or maintenance procedures. Diagnostic time is wasted. Parts must be located manually. Work is duplicated. Skills are mismatched to tasks.
The most costly manifestation of this inefficiency is overtime. Emergency breakdowns require immediate response regardless of the hour — nights, weekends, and holidays.
Technicians called out after hours are typically paid at 1.5x to 2x standard rates. A maintenance team that spends 40% of its time on emergency repairs is spending 40% of its labor budget at a premium rate for avoidable work.
- 1.5–2× - Typical overtime pay rate multiplier for after-hours emergency maintenance callouts, applied to the portion of labor hours consumed by reactive repairs.
2.6 Asset Deterioration and Premature Capital Expenditure
Equipment that is run without adequate preventive maintenance wears out faster. This is not a theoretical proposition — it is a mechanical certainty. Inadequate lubrication accelerates bearing wear. Missed calibrations allow drift that stresses components outside design tolerances.Deferred filter changes allow contaminants to damage internal surfaces. The cumulative effect is a shortened asset lifecycle that forces capital replacement years ahead of schedule.
Studies show that reactive maintenance costs 3 to 5 times more than preventive maintenance over an asset’s full lifecycle. In facilities relying primarily on breakdown maintenance, the total lifecycle cost of assets — including early replacement capital expenditure — can be dramatically higher than in comparable facilities running structured preventive programs.
U.S. factories are estimated to be using approximately $40 billion worth of outdated equipment, much of it deteriorated prematurely due to inadequate maintenance.
Section 3: How CMMS Software Prevents Revenue Loss
A CMMS is a centralized digital platform for managing all aspects of maintenance operations: scheduling preventive tasks, managing work orders, tracking parts inventory, recording asset history, and generating analytics that support data-driven decision-making.
When properly implemented, a CMMS directly addresses every category of revenue loss identified in Section 2, often with quantifiable and auditable financial results.
3.1 Preventing Emergency Parts Shipments Through Intelligent Inventory Management
A CMMS maintains a live, accurate inventory of spare parts and consumables, tracks historical consumption patterns, and can be configured to trigger automated reorder alerts when stock falls below defined thresholds. Critically, it links inventory records to preventive maintenance schedules, allowing the system to anticipate parts requirements before maintenance tasks begin — not after equipment has already failed.- Stockout Prevention: Automated reorder alerts eliminate stockouts of critical parts, removing the need for emergency procurement
- Right-Sizing: Historical consumption data drives right-sized inventory, freeing capital previously locked in excess stock
- Parts Kitting: Pre-staged parts kits for scheduled PM tasks eliminate diagnostic delay and parts-hunting during maintenance windows
- Purchasing Leverage: Supplier performance tracking and preferred vendor integration enables better pricing through planned purchasing rather than emergency channels
Emergency premiums are replaced by bulk discounts. Freight costs normalize. The parts budget becomes predictable and controllable.
3.2 Eliminating Downtime Delays Through Preventive and Predictive Maintenance
The most powerful financial impact of a CMMS is the shift it enables from reactive to preventive maintenance — or, in advanced deployments, to predictive maintenance. By scheduling and tracking regular maintenance activities on every critical asset, a CMMS ensures that equipment is serviced before failure, not after.- 30–50% - Reduction in unplanned downtime incidents typically achieved by facilities that transition from reactive to structured preventive maintenance programs.
- 5-Point OEE - A conservative 5-point improvement in Overall Equipment Effectiveness (OEE) on a $10M production line recovers $500,000 in previously hidden productive capacity.
Research by Fabrico (2026) documents that a 5-point OEE improvement is a typical outcome of closing the gap between downtime detection and structured maintenance response.
For a facility with a single production line generating $12 million in annual output, even a conservative improvement from 68% OEE to 73% OEE recovers $600,000 in revenue-generating capacity — without a single capital investment.
Advanced CMMS platforms integrated with IoT sensors and condition-monitoring technology can extend this capability to true predictive maintenance, detecting equipment degradation before failure occurs.
AI-powered condition monitoring can detect anomalies 30 or more days in advance, enabling scheduled repair during planned downtime windows. The U.S. Department of Energy documents that predictive maintenance saves 8% to 12% over preventive maintenance and up to 40% over reactive maintenance.
3.3 Protecting Product Quality Through Maintenance Compliance
A CMMS enforces maintenance compliance by scheduling inspections, calibrations, and preventive tasks on a systematic basis and generating work orders that must be acknowledged and closed.Where organizations without a CMMS rely on memory, paper logs, or informal communication, a CMMS creates an enforceable, auditable record of every maintenance activity performed on every asset.
This systematic compliance has direct and measurable quality outcomes. Facilities that maintain PM compliance rates above 95% demonstrate 3.2 times lower recall risk than those below 80% compliance. Companies that deploy predictive maintenance platforms have reduced contamination-related incidents by up to 78% within the first year.
For food and beverage manufacturers, pharmaceutical producers, and other industries with regulatory quality obligations, this compliance documentation also serves as evidence in regulatory audits.
- Precision: Calibration scheduling prevents dimensional drift and specification violations
- Contamination: Seal and gasket replacement intervals eliminate contamination pathways before they develop
- Wear Debris: Lubrication schedules prevent bearing wear that generates metal contamination
- Process Integrity: Heat exchanger and temperature-critical system maintenance ensure process parameters are met consistently
When the average direct cost of a food recall is $10 million — and the total impact can reach $30 to $50 million — a CMMS investment that reduces recall risk even marginally pays for itself many times over.
3.4 Protecting Delivery Commitments Through Operational Reliability
A CMMS does not just maintain equipment — it maintains the reliability that production schedules depend on. By reducing unplanned downtime incidents, sustaining higher OEE, and ensuring that maintenance activities are scheduled around production requirements rather than disrupting them, a CMMS directly protects the operational continuity that enables consistent on-time delivery.CMMS data enables operations teams to identify which assets carry the highest downtime risk and prioritize their maintenance accordingly. This risk-based approach ensures that the equipment most critical to production continuity — bottleneck assets, single points of failure, long-lead-time components — receive the most rigorous maintenance attention.
The result is fewer surprise failures at critical production moments, fewer missed shipments, and fewer penalty-triggering delivery delays.
Customer Retention Impact
Every missed delivery deadline is both a current and future revenue risk. Research consistently shows that customers who experience a significant service failure are far more likely to switch to a competitor at their next procurement cycle. In B2B manufacturing relationships, the lifetime value of a retained customer can be 5 to 25 times the value of the order affected by a single delivery failure.
3.5 Labor Efficiency and Overtime Reduction
A CMMS transforms maintenance labor from a reactive, crisis-driven cost center into a planned, efficient operation. By scheduling maintenance proactively, providing technicians with digital work orders, equipment history, and parts information on mobile devices, and eliminating the diagnostic delays associated with unfamiliar failures, a CMMS enables the same workforce to accomplish significantly more — at standard labor rates, during normal hours.- 20–30% - Reduction in overall maintenance costs typically achieved by organizations that shift from reactive to preventive maintenance strategies using a CMMS.
Technicians spend their time doing maintenance rather than managing paperwork. Managers gain real-time visibility into team workload and can allocate resources more effectively.
Overtime hours — the most expensive category of maintenance labor — are dramatically reduced as emergency callouts are replaced by scheduled work.
3.6 Asset Life Extension and Capital Expenditure Deferral
Properly maintained equipment lasts longer. This is perhaps the most strategically significant financial benefit of a CMMS, because deferred capital expenditure is not simply a cost reduction — it is a preservation of working capital that can be deployed for growth, innovation, or debt reduction.Studies show that CMMS-enabled preventive maintenance programs can extend the productive life of capital assets by years. CMMS analytics identify the optimal point in an asset’s lifecycle when replacement becomes more cost-effective than continued maintenance — enabling rational, data-driven capital planning rather than crisis-driven equipment replacement.
Fixing equipment before failure also reduces the need for replacement parts by up to 40%, reducing both costs and material waste.
Section 4: Key Industry Statistics at a Glance
The following table consolidates the most significant research findings documenting the financial case for CMMS adoption:
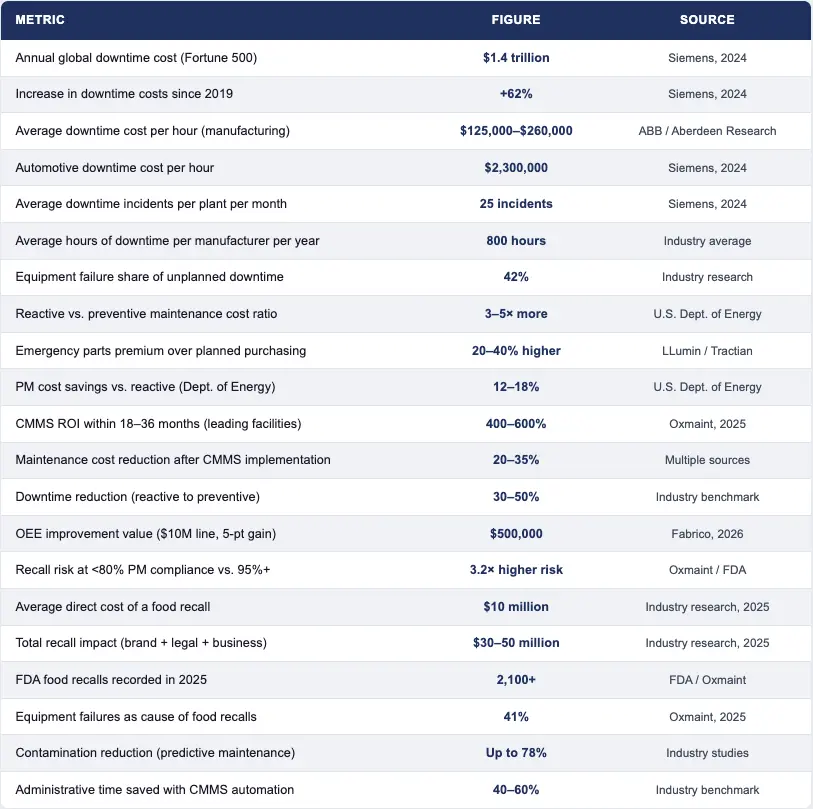
Statistics represent research findings and benchmarks compiled from multiple independent sources. Actual results will vary by facility, industry, and implementation approach.
Section 5: Calculating Your CMMS ROI
The return on a CMMS investment is highly facility-specific, but the calculation framework is consistent across industries. Leading facilities achieve 400 to 600% ROI within 18 to 36 months of full deployment. Most organizations see a return of 300 to 600% within the first year when baseline inefficiencies are significant. The key value drivers are:
Hard Savings:
- Reduced unplanned downtime: measured in hours recovered × production value per hour
- Lower maintenance labor cost: fewer emergency callouts, less overtime, more efficient technician deployment
- Reduced MRO inventory: right-sized stock levels free capital and reduce carrying costs
- Emergency procurement elimination: parts purchased at standard pricing on planned schedules
Cost Avoidance:
- Quality cost reduction: fewer defects, returns, and recalls attributable to maintenance failures
- Delivery penalty avoidance: fewer missed commitments, fewer contractual penalties
- Asset life extension: deferred capital expenditure as assets serve their full intended lifecycle
- Compliance penalty avoidance: complete maintenance records supporting regulatory inspections
CFOs and finance leaders should note that CMMS ROI calculation methods that capture only direct labor savings undercount total value by 25 to 40%, because they miss prevented downtime events, extended equipment life, inventory carrying cost reductions, and energy efficiency improvements. A comprehensive ROI framework must account for both hard savings and cost avoidance across all eight categories above.
Worked Example
A 10-technician manufacturing plant with $45,000 in annual CMMS investment achieves hard savings of over $360,000 in year one through downtime reduction, labor efficiency gains, and inventory optimization. ROI: ($360,000 − $41,000) / $41,000 = 778% in the first year. (Limble CMMS case study)
Key Sources & References
The following primary research sources were drawn upon in the preparation of this article:
- Siemens. (2024). The True Cost of Downtime 2024. Senseye Predictive Maintenance.
- ABB. (2023–2024). Value of Reliability Report. Survey of 3,200+ global plant maintenance leaders.
- Aberdeen Research. Manufacturing downtime cost benchmarks. Industry average: $260,000/hour.
- U.S. Department of Energy. Preventive Maintenance cost-savings documentation (12–18% over reactive; 40% predictive vs. reactive).
- Oxmaint. (2025). Product Recall Prevention Through Maintenance & Quality. FDA recall data, 2025.
- Fabrico. (2026). CMMS ROI in Manufacturing: The Financial Case Your CFO Cannot Argue With.
- Gartner. (2024). Downtime cost estimates by industry and enterprise size.
- Vanson Bourne Research. Unplanned downtime survey — 82% of companies, avg. 4-hour incidents at $2M/event.
- Oxford Economics / Splunk. Global 2000 downtime cost analysis: $400 billion annually.
- Limble CMMS. ROI calculator and case study: 778% first-year return on $45,000 investment.
- LLumin Inc. CMMS ROI analysis and preventive maintenance cost-savings documentation.
- IDS-INDATA. (2026). The Real Cost of Downtime in Manufacturing: Sector-by-Sector Breakdown.
- TeamSense. (2026). The Cost of Downtime in Manufacturing.
This article is intended for informational and educational purposes. Industry statistics represent research findings and benchmarks compiled from multiple independent sources. Actual results will vary by facility, industry, and implementation approach.