
Tired of constant firefighting? We get it. It leads to downtime, unplanned costs, and technician burnout. Moving from reactive to proactive maintenance feels like a huge leap, but it doesn’t have to be.
The most successful teams don’t do it all at once. They make progress with steady, repeatable 90-day cycles.
We’ve broken this down into a simple plan that gives you a practical roadmap to evolve your maintenance strategy, one level at a time.
Our Approach
Our approach is built on the maintenance maturity model, a framework we developed to measure and improve your operations. But before you jump in, take a few minutes to complete our maintenance maturity assessment.
It gives you a clear baseline, so you can pick the right 90-day plan and start making real progress today.
Steps to evolve your maintenance strategy
- Establish a Baseline - Use an assessment to understand your current maturity level.
- First 90 Days (Level 1 to 2)- Centralize work intake, launch core preventive maintenance, and get control of critical spares.
- Next 90 Days (Level 2 to 3) - Introduce condition-based tasks, use failure codes, and speed up data capture with mobile tools.
- Final 90 Days (Level 3 to 4) - Use dashboards to forecast work, pilot a predictive use case, and start proving your value with data.
Start with a Baseline
You can’t improve what you don’t measure. So, the first step is getting a clear picture of where your maintenance program stands today. Run our free maintenance maturity assessment and jot down your overall level and the four sub-scores for work management, materials, data, and strategy.Once you have your score, just pick the matching 90-day plan below. Each one is built to move you up one level.
For example, if you score as a Level 1 (Reactive), you’ll follow the “Level 1 to Level 2” plan.
After 90 days, re-score your team to see your progress and grab your next plan. This simple cycle of assessing and acting is what builds a solid maintenance roadmap. And it all starts with getting your data and workflows organized in one central system, that’s what good CMMS software is all about.
Level 1 to 2: Your First 90 Days
Outcome - Stabilize work intake, create core preventive maintenance (PMs), and stop repeat failures on your most important assets.
Weeks 1–2 - Centralize Work and Priorities
Let's put an end to managing work through random texts, emails, and sticky notes. Set up a single place for all maintenance requests to come in. A simple work order software lets you create, assign, and track every single job.
Then, define a short list of priorities (like P1-Emergency, P2-High, P3-Normal) and spend 10 minutes every morning reviewing the open work list. This makes sure your team is always focused on the right tasks.
Weeks 3–6 - Launch Core PMs with Checklists
Pinpoint your 10–20 most important assets and build a preventive maintenance program just for them. You can start simple with time-based PMs (weekly, monthly) or usage-based ones (every 100 hours).
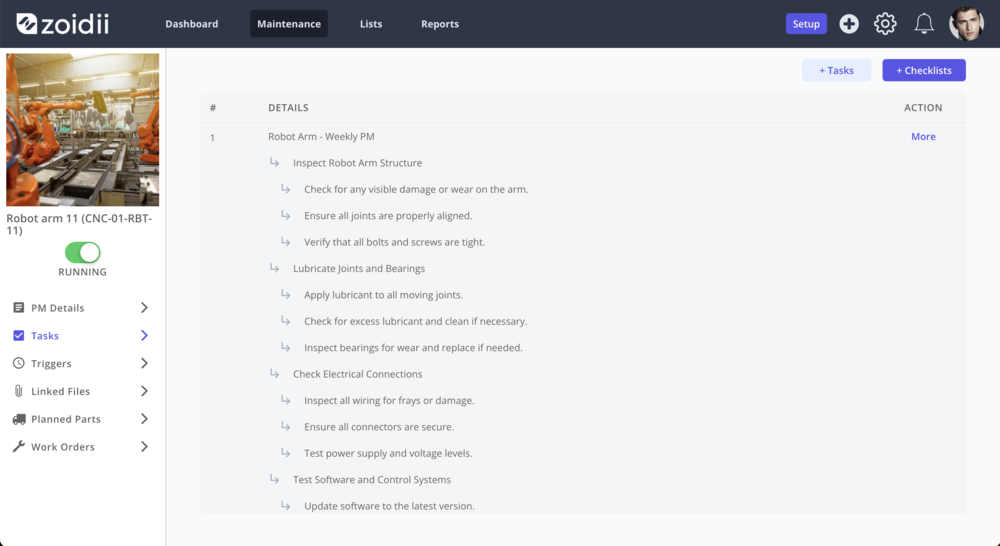
Attach digital maintenance checklists to each PM to standardize the work, boost quality, and make sure safety steps aren't missed.
Weeks 7–12 - Get Parts and Purchasing Basics in Place
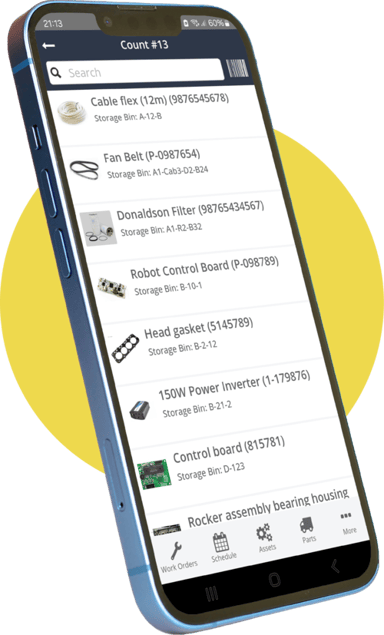
Nothing stops a job faster than a missing part. It’s time to get a handle on your inventory. Add your most important CMMS spare parts to your system and set minimum and maximum stock levels.
Keep an eye on stockouts to figure out which parts you absolutely need to have on hand. For your regular buys, a simple purchase order software can create and track orders, so you always know what’s on its way.
Weekly Habit - The Short Review
Just 15 minutes a week. Look at three numbers:
- PM compliance
- Overdue work orders,
- The top five failure causes you see in technician notes
And if your team is still trekking back to a desktop to log work, now is the perfect time to introduce mobile CMMS software. Putting work orders and asset history right in their hands saves a ton of time and makes your data much more accurate.
Level 2 to 3: Your Next 90 Days
Outcome - Move from purely time-based work to condition-based tasks by capturing better signals and cleaner data from the field.
Weeks 1–2 - Add Meters and Inspections
It's time to go beyond simple time-based triggers. For your top assets, start attaching meter readings (like hours, cycles, or temperature) or simple inspection forms to your maintenance PMs.
Make these readings a required field when closing out a work order to make sure you’re getting consistent data.
Weeks 3–6 - Start Using Failure Codes and Alerts
Let's standardize how you close out work. Create a short, consistent list of cause and action codes for technicians to choose from. Suddenly, all those free-text notes turn into reportable data.
At the same time, set up automated alerts in your preventive maintenance software. For instance, a temperature reading that goes above a certain threshold can automatically create an inspection work order.
Weeks 7–12 - Speed Up Data Capture with Mobile and QR Codes
Tired of manual data entry and the mistakes that come with it? Start using QR code equipment maintenance by tagging your assets and parts bins.
A technician can just scan a QR code with their phone to pull up asset history, log their time, and record parts used; all right there in the field.
Adding QR codes to your regular PM routes also makes it much faster to find and kick off scheduled jobs.
Weekly Habit: Clean Your Signals
Take a look at three to five recent failures. Ask yourself: did the data give us any warning? Use what you learn to tweak your inspection checklists or alert thresholds.
You should also look for overlapping PMs that can be combined or tasks that just don't add value anymore and can be scrapped.
Level 3 to Level 4: Your Final 90 Days
Outcome - Use data to forecast upcoming work, reduce unnecessary PMs, and schedule jobs at the optimal time to prevent failures.
Weeks 1–2 - Get Your Dashboards in Place
It’s time to get your data working for you. Create a single dashboard that shows your most important numbers:
- PM compliance
- Backlog in weeks
- Mean Time To Repair (MTTR)
- Stockouts
A CMMS ROI calculator can help you connect your operational improvements directly to bottom-line savings.
Weeks 3–6 - Convert CBM Signals to Timely Work
For every meter reading or inspection point, decide exactly what triggers a work order and where it should go.
Document this "alert to work order to closeout" flow in a simple standard operating procedure (SOP). This makes sure that every condition-based signal is acted on consistently and without delay.
Weeks 7–12 - Pilot One Predictive Use Case
You don't need expensive, complex sensors to get started with predictive maintenance.
Just pick one or two important assets where you already have good condition data. Define a clear way to measure success, like downtime hours avoided or money saved on emergency repairs. Track the outcomes closely and tweak your triggers based on the results.
A predictive maintenance roi calculator can help you put a dollar value on these early wins.
Weekly Habit - Prove Your Value
Make your progress visible to everyone. In your daily stand-up meetings, share a win from the previous day.
It could be a chart showing reduced downtime, a photo of a perfectly organized parts room, or a quick note about how much money was saved by avoiding an emergency repair.
Keep Your Progress Steady After 90 Days
Moving from reactive to proactive maintenance is an ongoing cycle, not a one-time project. After each 90-day sprint, take a moment to celebrate your wins, reassess your maturity, and pick your next set of priorities. The real secret is to lock in your gains with consistent habits.
- Keep the Weekly Review - This 30-minute meeting should be a permanent fixture on your calendar. It’s where you turn data into action.
- Run Quarterly Audits - Once a quarter, do a quick CMMS audit to check for data quality and compliance. Are checklists being followed? Are work orders being closed out correctly?
- Reassess and Repeat - Use the maintenance maturity assessment each quarter to measure your progress and decide what to focus on for your next 90-day plan.
For a clear view of the levels and what changes at each stage, see the maintenance maturity model.
Steps to Evolve Your Maintenance Strategy FAQ
1. How long does it take to see results?
Most teams start seeing fewer surprises in just 4–6 weeks once they get their work intake, PMs, and parts organized. You can see the full 90-day maintenance plan here.
2. Do we need expensive sensors to be proactive?
Nope. You can start with simple things like operator inspections and meter readings. You can always add sensors later for your most important assets where it makes sense. Get more details on preventive maintenance software here.
3. What are the most important metrics to measure weekly?
PM compliance, backlog in weeks, MTTR, and stockouts are great numbers to watch to help you steer the week. For a simple way to show the financial value of your improvements, check out the cmms roi calculator.
4. What if our maintenance data is messy?
Don't wait, start now. Just enforce better closeout notes and failure codes on all new work orders going forward. You can clean up old data over time as you come across it. For some practical tips on getting your data organized, see how a CMMS supports maturity growth.
Take the Next Step from Reactive to Proactive
See how Zoidii makes it simple to organize work, schedule PMs, and track everything in one place.
Book a Demo and see how you can save hours each week with a personalized tour of Zoidii.
With our Free Trial, you can get hands-on and see how easy it is to reduce stockouts and get faster closeouts.
Level 2 to 3: Your Next 90 Days
Outcome - Move from purely time-based work to condition-based tasks by capturing better signals and cleaner data from the field.
Weeks 1–2 - Add Meters and Inspections
It's time to go beyond simple time-based triggers. For your top assets, start attaching meter readings (like hours, cycles, or temperature) or simple inspection forms to your maintenance PMs.
Make these readings a required field when closing out a work order to make sure you’re getting consistent data.
Weeks 3–6 - Start Using Failure Codes and Alerts
Let's standardize how you close out work. Create a short, consistent list of cause and action codes for technicians to choose from. Suddenly, all those free-text notes turn into reportable data.
At the same time, set up automated alerts in your preventive maintenance software. For instance, a temperature reading that goes above a certain threshold can automatically create an inspection work order.
Weeks 7–12 - Speed Up Data Capture with Mobile and QR Codes
Tired of manual data entry and the mistakes that come with it? Start using QR code equipment maintenance by tagging your assets and parts bins.
A technician can just scan a QR code with their phone to pull up asset history, log their time, and record parts used; all right there in the field.
Adding QR codes to your regular PM routes also makes it much faster to find and kick off scheduled jobs.
Weekly Habit: Clean Your Signals
Take a look at three to five recent failures. Ask yourself: did the data give us any warning? Use what you learn to tweak your inspection checklists or alert thresholds.
You should also look for overlapping PMs that can be combined or tasks that just don't add value anymore and can be scrapped.
Level 3 to Level 4: Your Final 90 Days
Outcome - Use data to forecast upcoming work, reduce unnecessary PMs, and schedule jobs at the optimal time to prevent failures.
Weeks 1–2 - Get Your Dashboards in Place
It’s time to get your data working for you. Create a single dashboard that shows your most important numbers:
- PM compliance
- Backlog in weeks
- Mean Time To Repair (MTTR)
- Stockouts
A CMMS ROI calculator can help you connect your operational improvements directly to bottom-line savings.
Weeks 3–6 - Convert CBM Signals to Timely Work
For every meter reading or inspection point, decide exactly what triggers a work order and where it should go.
Document this "alert to work order to closeout" flow in a simple standard operating procedure (SOP). This makes sure that every condition-based signal is acted on consistently and without delay.
Weeks 7–12 - Pilot One Predictive Use Case
You don't need expensive, complex sensors to get started with predictive maintenance.
Just pick one or two important assets where you already have good condition data. Define a clear way to measure success, like downtime hours avoided or money saved on emergency repairs. Track the outcomes closely and tweak your triggers based on the results.
A predictive maintenance roi calculator can help you put a dollar value on these early wins.
Weekly Habit - Prove Your Value
Make your progress visible to everyone. In your daily stand-up meetings, share a win from the previous day.
It could be a chart showing reduced downtime, a photo of a perfectly organized parts room, or a quick note about how much money was saved by avoiding an emergency repair.
Keep Your Progress Steady After 90 Days
Moving from reactive to proactive maintenance is an ongoing cycle, not a one-time project. After each 90-day sprint, take a moment to celebrate your wins, reassess your maturity, and pick your next set of priorities. The real secret is to lock in your gains with consistent habits.
- Keep the Weekly Review - This 30-minute meeting should be a permanent fixture on your calendar. It’s where you turn data into action.
- Run Quarterly Audits - Once a quarter, do a quick CMMS audit to check for data quality and compliance. Are checklists being followed? Are work orders being closed out correctly?
- Reassess and Repeat - Use the maintenance maturity assessment each quarter to measure your progress and decide what to focus on for your next 90-day plan.
For a clear view of the levels and what changes at each stage, see the maintenance maturity model.
Steps to Evolve Your Maintenance Strategy FAQ
1. How long does it take to see results?
Most teams start seeing fewer surprises in just 4–6 weeks once they get their work intake, PMs, and parts organized. You can see the full 90-day maintenance plan here.
2. Do we need expensive sensors to be proactive?
Nope. You can start with simple things like operator inspections and meter readings. You can always add sensors later for your most important assets where it makes sense. Get more details on preventive maintenance software here.
3. What are the most important metrics to measure weekly?
PM compliance, backlog in weeks, MTTR, and stockouts are great numbers to watch to help you steer the week. For a simple way to show the financial value of your improvements, check out the cmms roi calculator.
4. What if our maintenance data is messy?
Don't wait, start now. Just enforce better closeout notes and failure codes on all new work orders going forward. You can clean up old data over time as you come across it. For some practical tips on getting your data organized, see how a CMMS supports maturity growth.
Take the Next Step from Reactive to Proactive
See how Zoidii makes it simple to organize work, schedule PMs, and track everything in one place.
Book a Demo and see how you can save hours each week with a personalized tour of Zoidii.
With our Free Trial, you can get hands-on and see how easy it is to reduce stockouts and get faster closeouts.