Fixing the same pump seal three times in a single month isn't maintenance; it's a waste of your time. Most facilities lose up to 20% of their productive capacity to unplanned downtime because they never actually solve the problem. It's frustrating to sit through disorganized brainstorming sessions that lead nowhere while leadership demands immediate results.
You know that "band-aid" fixes don't work, yet the pressure to get machines running often forces you into a cycle of temporary repairs. This is where a fishbone diagram changes the game by forcing your team to look past the obvious and find the actual source of the failure.
We're going to keep this stupid simple. You'll learn how to use the fishbone method to identify the real reasons behind equipment failure so you can stop solving the same problems twice.
We'll walk through the 6M framework, show you how to organize your team's expertise, and provide a clear path to standardized root cause analysis.
By the end of this guide, you'll have a reliable way to reduce downtime and present professional failure analysis to the C-suite that actually makes sense.
Key Takeaways
- Stop solving the same problems twice by using a fishbone diagram to categorize and crush the real root causes of equipment failure.
- Master the "6 Ms" framework to ensure your team never overlooks critical failure points like machinery, methods, or materials.
- Learn how to leverage the "on-the-tools" expertise of your technicians to build a visual map of why assets actually break down.
- Understand when to use a broad fishbone analysis versus a narrow "5 Whys" approach to match the complexity of any maintenance headache.
- Discover how to use your CMMS history to move beyond paper diagrams and turn asset data into a permanent record of operational order.
What is a Fishbone Diagram? (The "Stupid Simple" Definition)
A fishbone diagram is a visual root cause analysis tool that helps maintenance teams stop guessing and start fixing. It’s a structured way to categorize the potential causes of a specific failure or "effect." Fishbone diagrams relate the “what happened” to the “why did this happen”.
Think of it as a map for your troubleshooting process. The "head" of the fish represents the problem you're trying to solve, such as a recurring pump failure or a 12% increase in downtime.
The "bones" branching off the spine represent the different categories where the cause might be hiding. If you need a technical deep dive, What is a Fishbone Diagram? It's a method also known as the Ishikawa diagram or a Cause-and-Effect diagram.
This isn't just an academic exercise for engineers. It's a core component of understanding what does osha stand for and adhering to general industrial safety standards. When a machine fails and puts a worker at risk, OSHA doesn't want to hear that you "fixed it." They want to know you found the root cause. Using a fishbone diagram ensures that your safety protocols are backed by a logical, documented investigation rather than a quick patch job.
Why Maintenance Teams Need It
Maintenance departments often fall into the trap of the "blame game." When a line goes down, it's easy to blame the operator or a "bad part." This tool shifts the focus from people to systems. It identifies hidden bottlenecks that simple observation misses, such as a 20% variance in temperature that only happens during the third shift. It also provides a professional record of your troubleshooting.Whether you're dealing with insurance claims or a formal audit, having a completed diagram proves your team follows a rigorous, expert-led process to maintain asset reliability.
The History of the Ishikawa Diagram
Kaoru Ishikawa developed this tool in the 1960s at the Kawasaki shipyards in Japan. He didn't design it for boardrooms; he built it for the floor. Ishikawa’s goal was to empower every worker to participate in quality improvement, not just the folks with "Manager" in their title.By the 1970s, it became one of the "Seven Basic Tools of Quality Control." It has remained a staple in lean manufacturing for over 60 years because it’s stupid simple to use but incredibly effective at uncovering the truth behind equipment failure. It turns a chaotic breakdown into a clear path toward operational order.
The 6 Ms of Maintenance: Categorizing Why Assets Fail
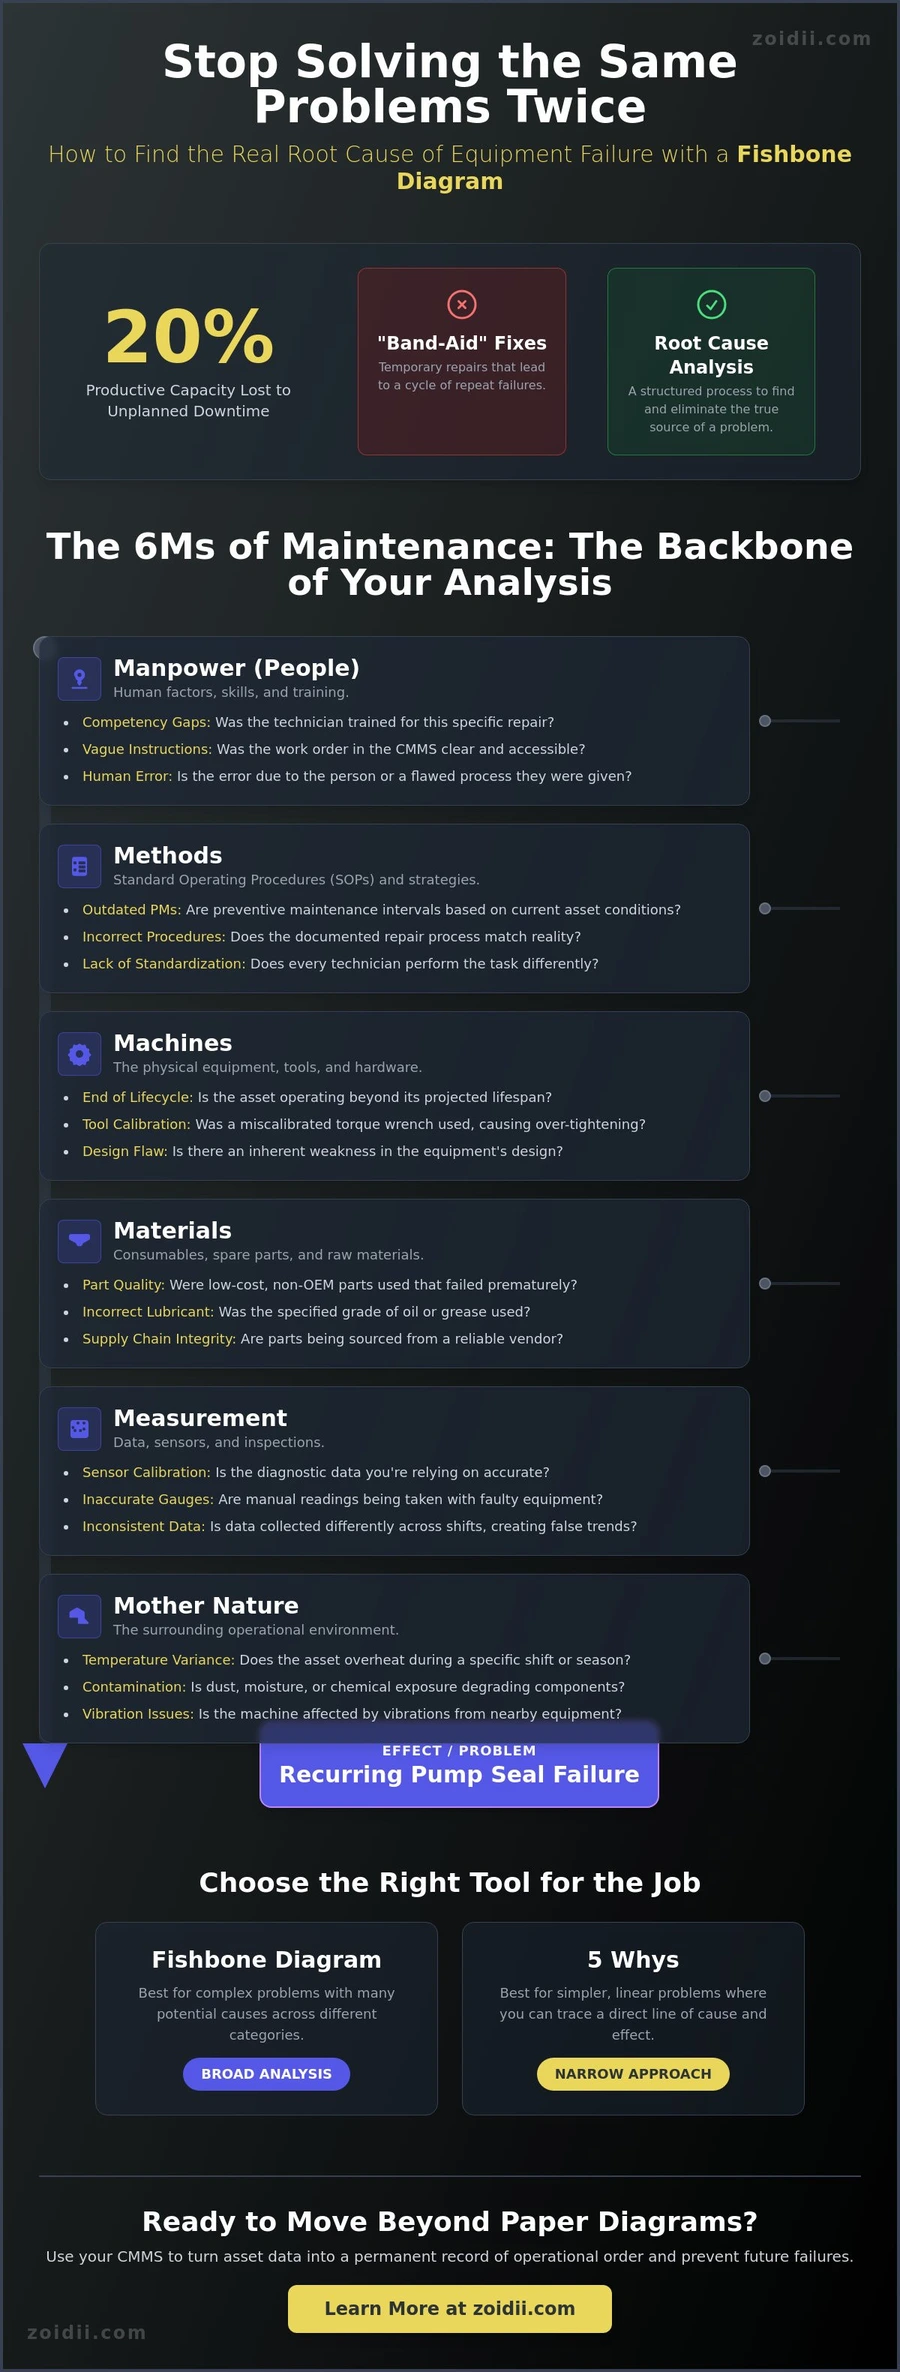
The 6 Ms of maintenance serve as the backbone of industrial troubleshooting. When a critical asset goes offline, the natural reaction is to fix it fast and move on. But "it just broke" is a lazy excuse that leads to repeat failures. Using these six categories within your fishbone diagram ensures your team looks past the surface and identifies the structural weaknesses in your operation.
Manpower, Methods, and Machines
Manpower isn't just about having bodies on the floor. It's about competency and the quality of information available at the point of work. Was the technician trained for this specific repair? Often, the root cause is a lack of clear, accessible instructions within your cmms software. If the work order is vague, the results will be too. Human error is rarely about the person; it's usually about the process they were given.Methods refer to your standard operating procedures and maintenance strategies. An outdated preventive maintenance (PM) schedule is a silent killer. If your PM intervals haven't been reviewed since the equipment was installed in 2019, you're likely missing new wear patterns. Machines, the third M, focus on the hardware itself. Is the asset at the end of its projected 12-year lifecycle?
You should also audit the tools used for the repair. A miscalibrated torque wrench can lead to over-tightening, causing a catastrophic bearing failure just 48 hours after a routine fix.
Materials, Measurement, and Mother Nature
Materials often come down to procurement choices and supply chain integrity. Low-quality spare parts or the wrong lubricant grade can cause 15% more friction-related failures. If you're swapping OEM parts for cheap alternatives to save $200 today, your fishbone diagram will likely point right back to the stockroom when that part fails prematurely. High-quality inputs are the only way to ensure high-quality uptime.Measurement is all about the integrity of your diagnostic data. If your sensors aren't calibrated, you're flying blind. You need to ensure the data in your fixed asset management system is accurate to make informed capital expenditure calls. When deciding between a Fishbone vs. 5 Whys analysis, remember that the fishbone excels when measurement errors are suspected across multiple variables simultaneously.
Mother Nature covers environmental factors that your team can't control but must mitigate. Humidity, extreme temperature swings, or high dust levels can degrade components 25% faster than in a climate-controlled facility. If a specific motor fails every July, the ambient heat is your primary suspect. If you want to stop guessing and start solving, it's time to get your maintenance organized with a system that tracks these variables for you.
How to Build a Fishbone Diagram for Maintenance Teams
Fishbone diagrams can be a great troubleshooting aid for maintenance teams. Building a fishbone diagram isn't a desk job for a manager sitting in an office. It's a team effort that requires your product experts. These are the techs who actually turn the wrenches and hear the gearboxes grinding at 2 AM.
To get started, grab a whiteboard or a digital tool and gather the people who know the equipment best. You want the guys who have seen the asset run on its best days and its worst.
Defining the Problem Statement
The "head" of the fish is your problem statement. Avoid vague terms that lead to wandering conversations. Using a phrase like "the pump is broken" is a waste of time. Instead, use specific data points. Write "Pump 04 motor overheated twice in 48 hours" or "Asset 102 saw a 12% increase in vibration since the June 14th PM."Quantify the problem using downtime hours or repair costs. If a failure caused $5,500 in lost production, put that number right at the front. Ensure the entire team agrees on this definition before you draw a single branch. If you don't agree on the problem, you'll never agree on the solution.
Once the head is set, draw the spine and the main bones. Most maintenance teams use the 6 Ms as their primary branches: Machines, Methods, Materials, Mother Nature (Environment), Measurement, and Manpower. The Fishbone Diagram is a staple in quality management because it forces you to look at every possible angle of a failure. It keeps the team from jumping to conclusions or blaming the easiest target.
The Brainstorming Phase
This is a no-nonsense environment where every suggestion is mapped. Don't filter ideas yet; just get them on the board. Use the "5 Whys" technique for every sub-bone to go deeper into the cause. If a tech suggests "bad bearings" under the Machine branch, ask why they failed.Perhaps they weren't greased. Why? The auto-luber was empty. Why? The refill schedule was missed. This process turns a surface-level symptom into a root cause you can actually fix. It makes the whole process stupid simple by removing the guesswork.
As the diagram fills up, mark "verify" next to any causes that need physical inspection or data proof. Don't treat a hunch as a fact. If the team thinks high humidity (Mother Nature) caused a sensor to trip, check the facility climate logs from the day of the failure.
This evidence-based approach ensures you spend your budget on real solutions rather than chasing ghosts in the machinery. Focus on realizing your uptime goals by being ruthless with the facts.
Applying the 6M in fishbone diagram construction
The following is the process of building a fishbone diagram:
1. Identify the problem and write a detailed problem statement in the fish head.
2. Work with the team's subject matter experts to identify the major categories of failure for the assets. From my experience troubleshooting maintenance issues on equipment, Machines are very broad, so you may want to break that down into subcategories such as electronic, mechanical, pneumatic, and hydraulic.
3. Identify each category's causes and sub-causes by repeatedly asking, “Why does this happen?”. Add as many layers as needed. The causes of a problem may also fit into multiple categories. You could use the 5 whys problem-solving technique to identify the causes.
4. Analyze and refine the fishbone diagram.
5. Rank each category by severity so the most significant contributors to the problem can be actioned first.
6. Investigate the most likely causes further.
Here is a fishbone diagram example:
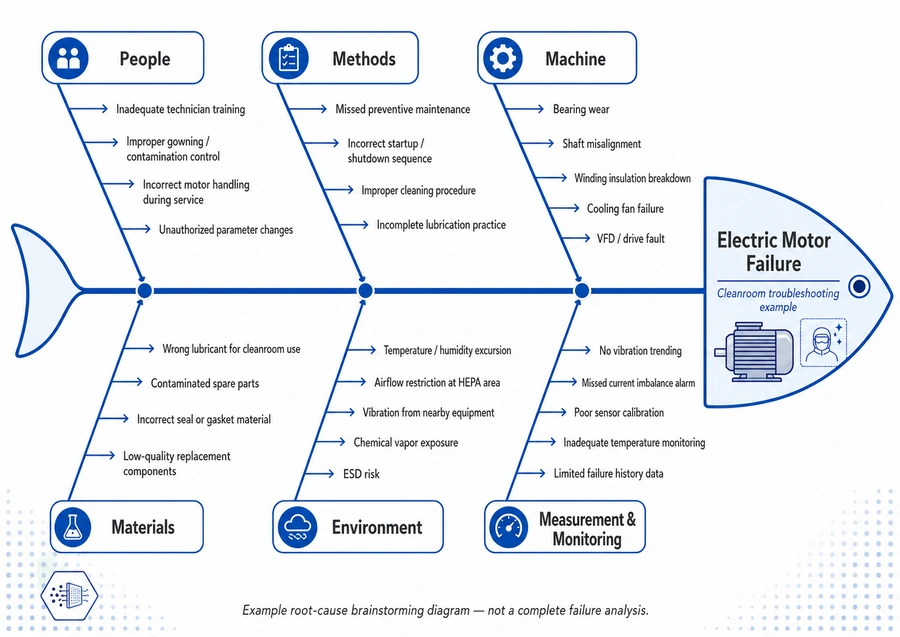
Looking at the example above, it is obvious how important it is to maintain good asset history in your CMMS software. Eliminate the possible causes on the diagram as they are investigated and logged as repair steps in the CMMS for future reference.
Fishbone vs. 5 Whys: Which Root Cause Tool Should You Use?
Root cause analysis isn't one-size-fits-all. You wouldn't use a sledgehammer to hang a picture frame; similarly, you don't need a full-scale brainstorming session for a loose bolt. The choice between a 5 Whys and a fishbone diagram depends entirely on the scale of the mess you're cleaning up. One is a quick drill, while the other is a full-scale excavation. Your tool selection must always depend on the severity and financial impact of the failure.
The 5 Whys is narrow and deep, perfect for tracing a straight line from a symptom to a cause. The fishbone diagram is broad and exploratory, designed to catch systemic issues that hide in the gaps between departments. Maintenance managers who hit their KPIs often combine both, starting with a quick 5 Whys and moving to a fishbone if the problem proves to be a recurring nightmare.
When to Use the 5 Whys
The 5 Whys is built for speed and efficiency. It's the best choice for simple, linear problems where one event clearly triggers the next. If a fuse blew because of a specific power surge at 3:15 PM, you don't need a cross-departmental committee. You just need to find out why the surge happened and how to prevent the next one.- Shop Floor Speed: Technicians can perform this in under 10 minutes without leaving the asset.
- Routine Documentation: It's ideal for standard work order comments on 80% of your daily maintenance tasks.
- Linear Logic: Use it when the path from the broken part to the cause is a straight line.
When to Use a Fishbone Diagram
Your technicians shouldn’t create fishbone diagrams whenever they experience a failure. Use a fishbone diagram when the problem is complex or a root cause is quickly apparent.If a critical conveyor belt has failed 4 times in the last 120 days despite following the PM schedule, the 5 Whys will likely fail you. You need to look at the environment, the quality of spare parts from Procurement, and the operating temperatures set by the Ops team.
- Cross-Departmental Issues: Essential when the solution requires buy-in from Maintenance, Ops, and Engineering.
- Chronic Failures: Necessary for "mystery" problems that keep reappearing on your downtime reports.
- High-Stakes Events: Use it for any failure that costs the facility more than $5,000 in lost production or repair costs.
When faced with complex issues, Fishbone diagrams are a great tool for facilitating brainstorming sessions and creative thinking. In addition, use fishbone diagrams retrospectively to help identify and visualize all root causes and contributing factors to the problem. Based on the findings, take proactive actions to help mitigate similar issues in the future.
Keep in mind that this approach aligns well with an effective preventive maintenance plan that addresses root causes before they lead to failures.
Ready to get your maintenance team organized and stop the guesswork? Book a demo with a Zoidii expert today and see how easy root cause tracking can be.
Moving Beyond Paper: Using CMMS Data for Fishbone Analysis
Paper diagrams are relics. They get coffee stains, they get lost, and they eventually disappear into filing cabinets where they help no one. A digital fishbone diagram powered by Zoidii stays in your asset history forever. It transforms a simple brainstorming session into a living record of your maintenance strategy. You won't have to guess what went wrong three years ago because the data is right there.
By moving the process into your CMMS, you ensure that every root cause analysis contributes to a permanent knowledge base that your entire team can access.
Feeding the Fish with Data
Stop relying on gut feelings or the loudest voice in the room. Pull a Mean Time Between Failures (MTBF) report to see which assets actually deserve your time. If a conveyor belt's MTBF dropped by 18% in the last 30 days, it's a prime candidate for analysis. Use Zoidii to review the last 50 work order comments to find recurring sub-causes that technicians mentioned in passing.You should also check inventory logs. If your "Material" bone shows a 12% spike in bearing failures after you switched to a cheaper supplier, the data has already found your root cause for you. This hard evidence populates your fishbone diagram with facts rather than opinions.
From Analysis to Action
A diagram without follow-up is just a drawing. It's a waste of your team's time. You need to create work orders immediately for every cause identified as "High Probability." If your "Method" bone reveals that technicians lack a specific calibration step, update your PM schedules in Zoidii right away. You can add that step to the digital checklist in under 60 seconds to prevent the error from happening again.For specialized repairs, use guest work orders to involve external contractors. They get the context they need without you having to hand over a stack of paper records. It's about keeping the process moving and making sure the "fix" is actually implemented.
Closing the loop is the final step in a no-nonsense maintenance culture. Once you've applied a solution, track the asset's performance for the next 90 days. If the failure rate hasn't dropped by at least 15%, your analysis likely hit a symptom instead of the root cause. Zoidii makes this tracking automatic. You can see the results on your dashboard and decide if you need to go back to the drawing board or if you've successfully realized your goal of a more reliable facility.
7 important tips to remember when building a fishbone diagram
The fishbone diagram is a great way to visualize the link between the problem and the many possible causes. However, it can become cumbersome, confusing, and time-consuming if you have too many “bones” and dig too deep. Here are some tips to ensure your maintenance team can drive value from it:
1. Using the 6M fishbone diagram template for maintenance and troubleshooting
It is a good idea to have a baseline fishbone diagram template ready for your facility that can be applied and modified when needed. To build your baseline fishbone diagram for your facility, an excellent place to start is the 5M. Work with the subject matter experts on the team to identify the significant categories of failure for our assets.2. Refining your fishbone diagram template over time for continuous improvement
The template should be continually reviewed and refined over time. Regularly updating it ensures that it aligns with the latest maintenance strategy and incorporates any new recurring issues that emerge.3. Defining clear problem statements for effective troubleshooting with fishbone diagrams
Ensure a well-defined problem statement. Instead of “Pump Failed”, use a more descriptive problem statement such as “On Tuesday 5th August 2025, pump 01 on machine XYZ failed while the system was running Y product”. That way, you can determine which pump failed, who was on shift, what raw materials or process was running, and other important information.4. Applying the five whys technique for deeper root cause analysis
Use the five whys technique to dig deep and identify all the root causes. This technique is critical to fishbone troubleshooting and ensures that deeper issues are uncovered, particularly in complex systems.5. Limiting the number of ribs to maintain clarity in fishbone diagrams
After ten ribs, the fishbone diagram becomes less effective as you investigate too many categories with nothing in them. Focus on high-impact categories and sub-causes to keep the analysis clear and actionable.6. Timing the fishbone analysis to maximize its impact during troubleshooting
Break out the fishbone diagram at the right time - when the team has spent a reasonable amount of time troubleshooting but is still unable to identify the repair's root cause.7. Collaborating effectively with your maintenance team using fishbone diagrams
Brainstorm and build the fishbone diagram on a large whiteboard. Use sticky notes for all the possible causes. This method allows for easy updates and visual tracking as new causes are identified and analyzed during the troubleshooting process.Turn Your Failure Data Into Maintenance Results
Stop treating symptoms and start killing the root cause. Using a fishbone diagram allows your team to look past the obvious breakdown and see the 6 Ms of failure clearly.
Whether it's a machine defect or a measurement error, you need a structured way to categorize the mess. While the 5 Whys work for simple glitches, the fishbone handles the complex, multi-variable headaches that plague your uptime.
You've learned how to map these problems; the next step is tracking them where it counts.
The real magic happens when you stop doing this on a dusty whiteboard. You need real-time data to feed your analysis. Zoidii is the #1-rated Cloud CMMS designed to get you organized fast. You can set it up in minutes, not months.
You get real-time maintenance reporting and analytics that turn your gut feelings into hard facts. It's stupid-simple software that works as hard as your team does. Don't let another shift pass with the same recurring failures.
Stop guessing and start fixing; Book a Zoidii demo today
Your assets deserve more than a quick fix. Give them a permanent solution and watch your reliability soar.